Beijingwalker
VIP Member

- Thread starter
- #1,876
The Renminbi Appears to be Undervalued by 30 Percent
China’s official current account data understate the scale of its external surplus and, by extension, the degree of renminbi undervaluation.Brad W. Setse rCFR EXPERT
Whitney Shepardson Senior Fellow
September 1, 2026 3:07 p.m.
Harvard’s Dr. Gopinath (formerly of the IMF) asked about the basis for my estimate (in Greg Ip’s excellent WSJ column) that the RMB is now undervalued by 30 percent.*
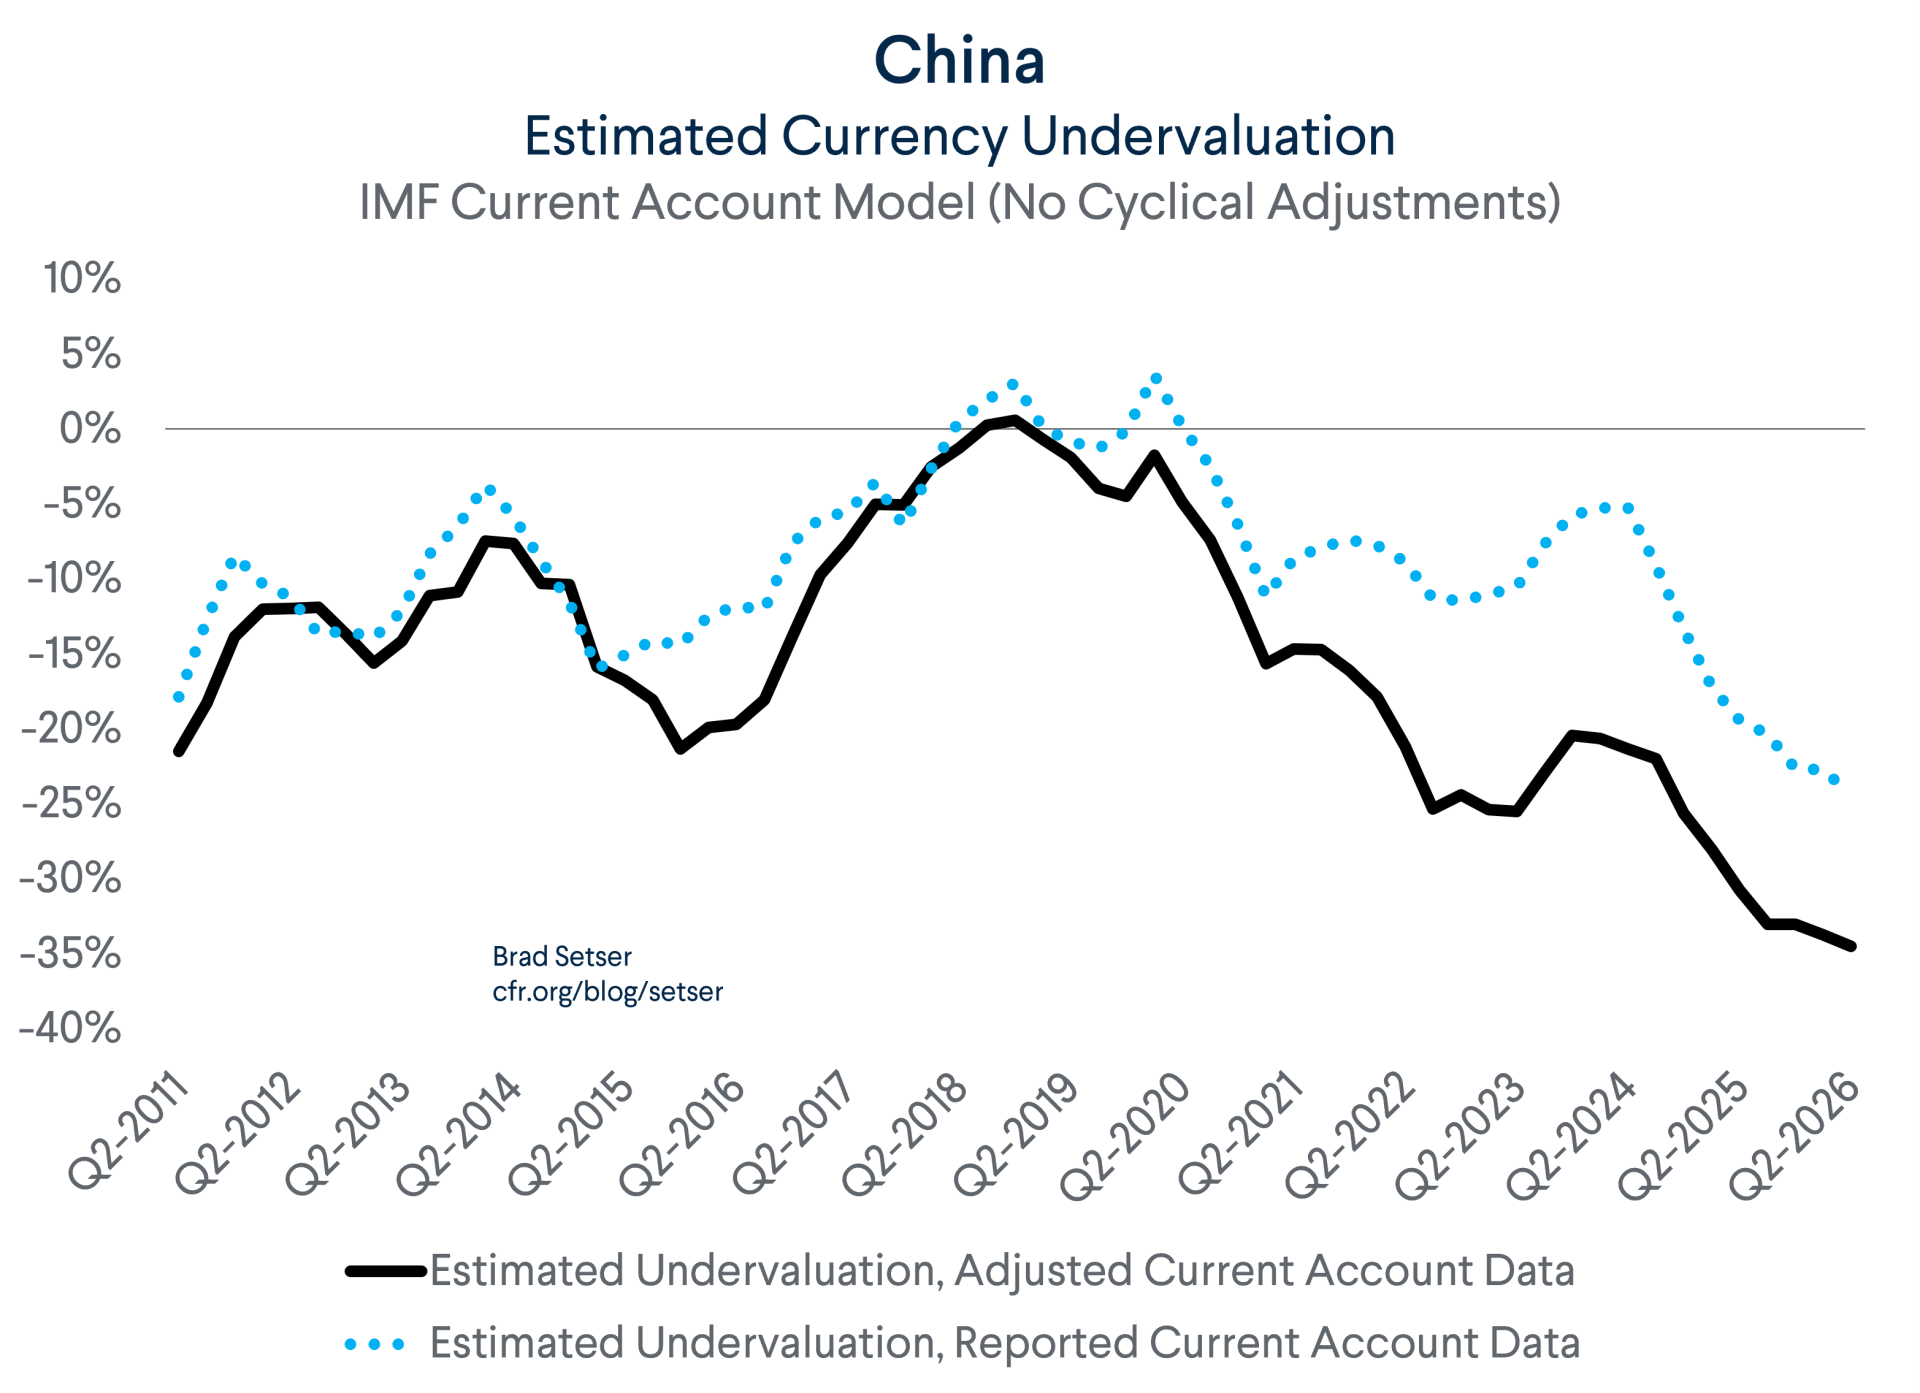
The simple answer: I used the IMF’s own current account methodology but didn’t take China’s reported current account surplus at face value. I believe that the surplus is significantly understated, as it doesn’t map to other known numbers about China’s economy and trade performance.**
The IMF’s current account gap methodology hinges on the difference between the observed current account and the “current account” norm calculated by the IMF (on the basis of demographics, levels of development, the net international investment position, and other variables). For China, that current account norm is now estimated at 0.6 percent of GDP (2026 ESR, Table 2.6)
A cyclical adjustment added 0.2 percent of GDP to the estimated norm for 2025. The end-2025 surplus was 3.8 percent of GDP. The 3 percent of GDP gap resulted in an estimated undervaluation of 21 percent as the IMF’s work implies that a 7 percent move in the exchange rate (or equivalent changes in other policies) reduces the surplus by a percentage point of GDP.
A bigger surplus thus implies a bigger “gap” and a bigger estimated undervaluation (for a given constellation of policies).
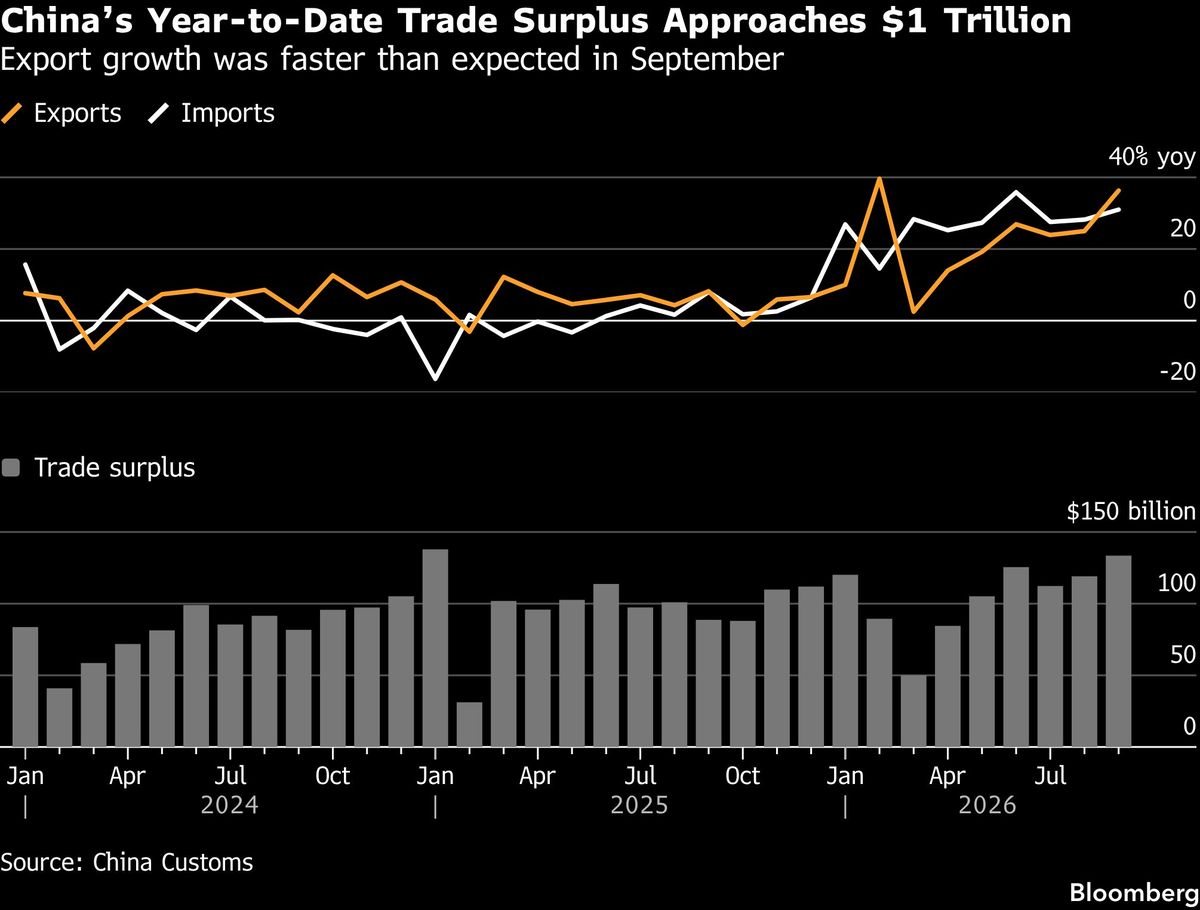
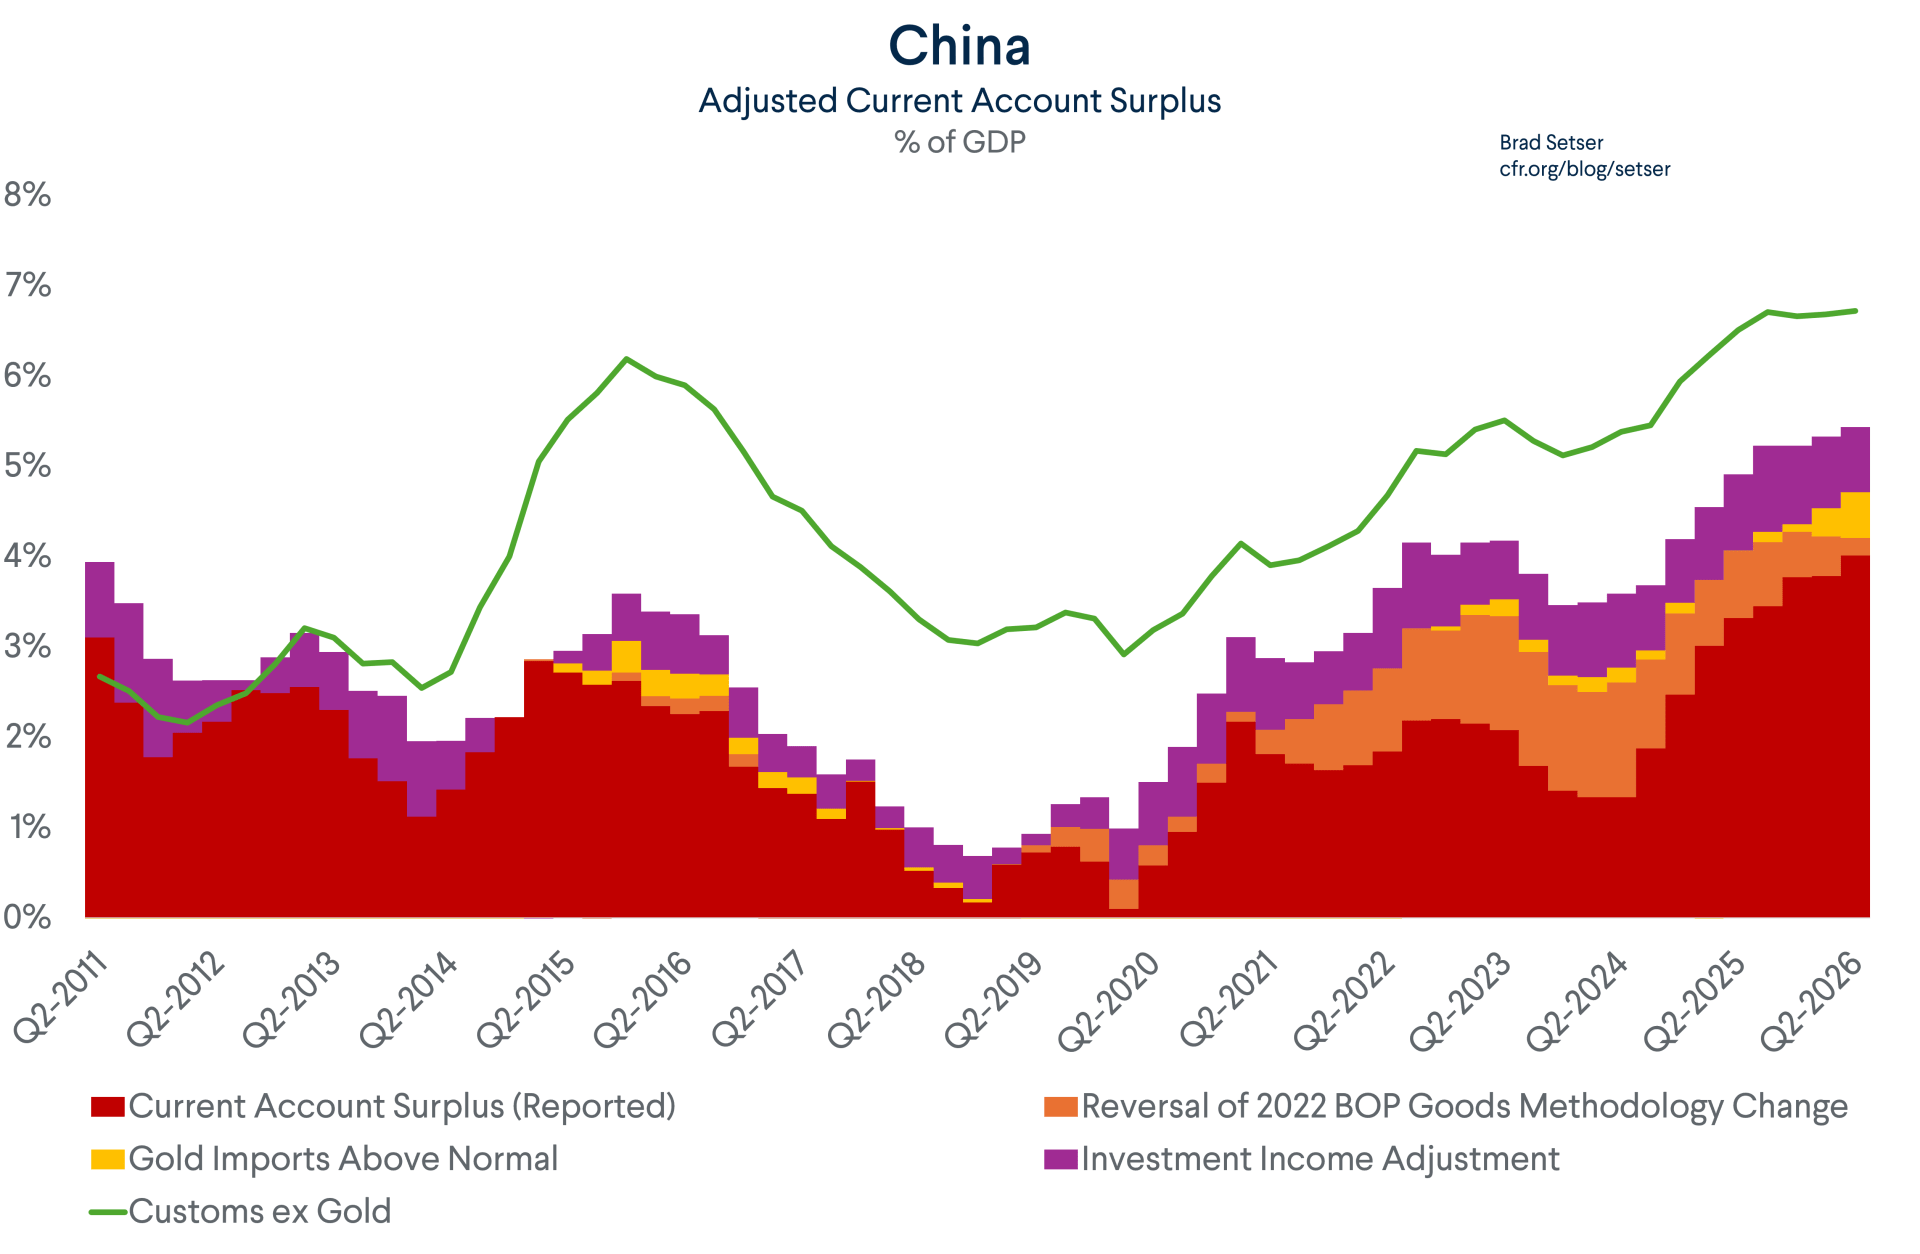
And I think the 3.8 percent of GDP surplus for end-2025, now up to 4 percent of GDP in the last four quarters of data, is understated. I am not the only one who thinks by the way; the raw customs data—adjusted for the observed deficit in travel services and the recent surge in gold imports—implies an overall surplus of close to 6 percent of GDP these days.
There are three reasons to believe that the reported current account surplus understates the scale of China’s real surplus:
1. The reported investment income deficit makes no economic sense.
The reported deficit on investment income is very hard to understand. You don’t have to take my word on this. The IMF looked into China’s investment income balance and agreed (2025 ESR, Box 1.1). So did Ma and Wei.
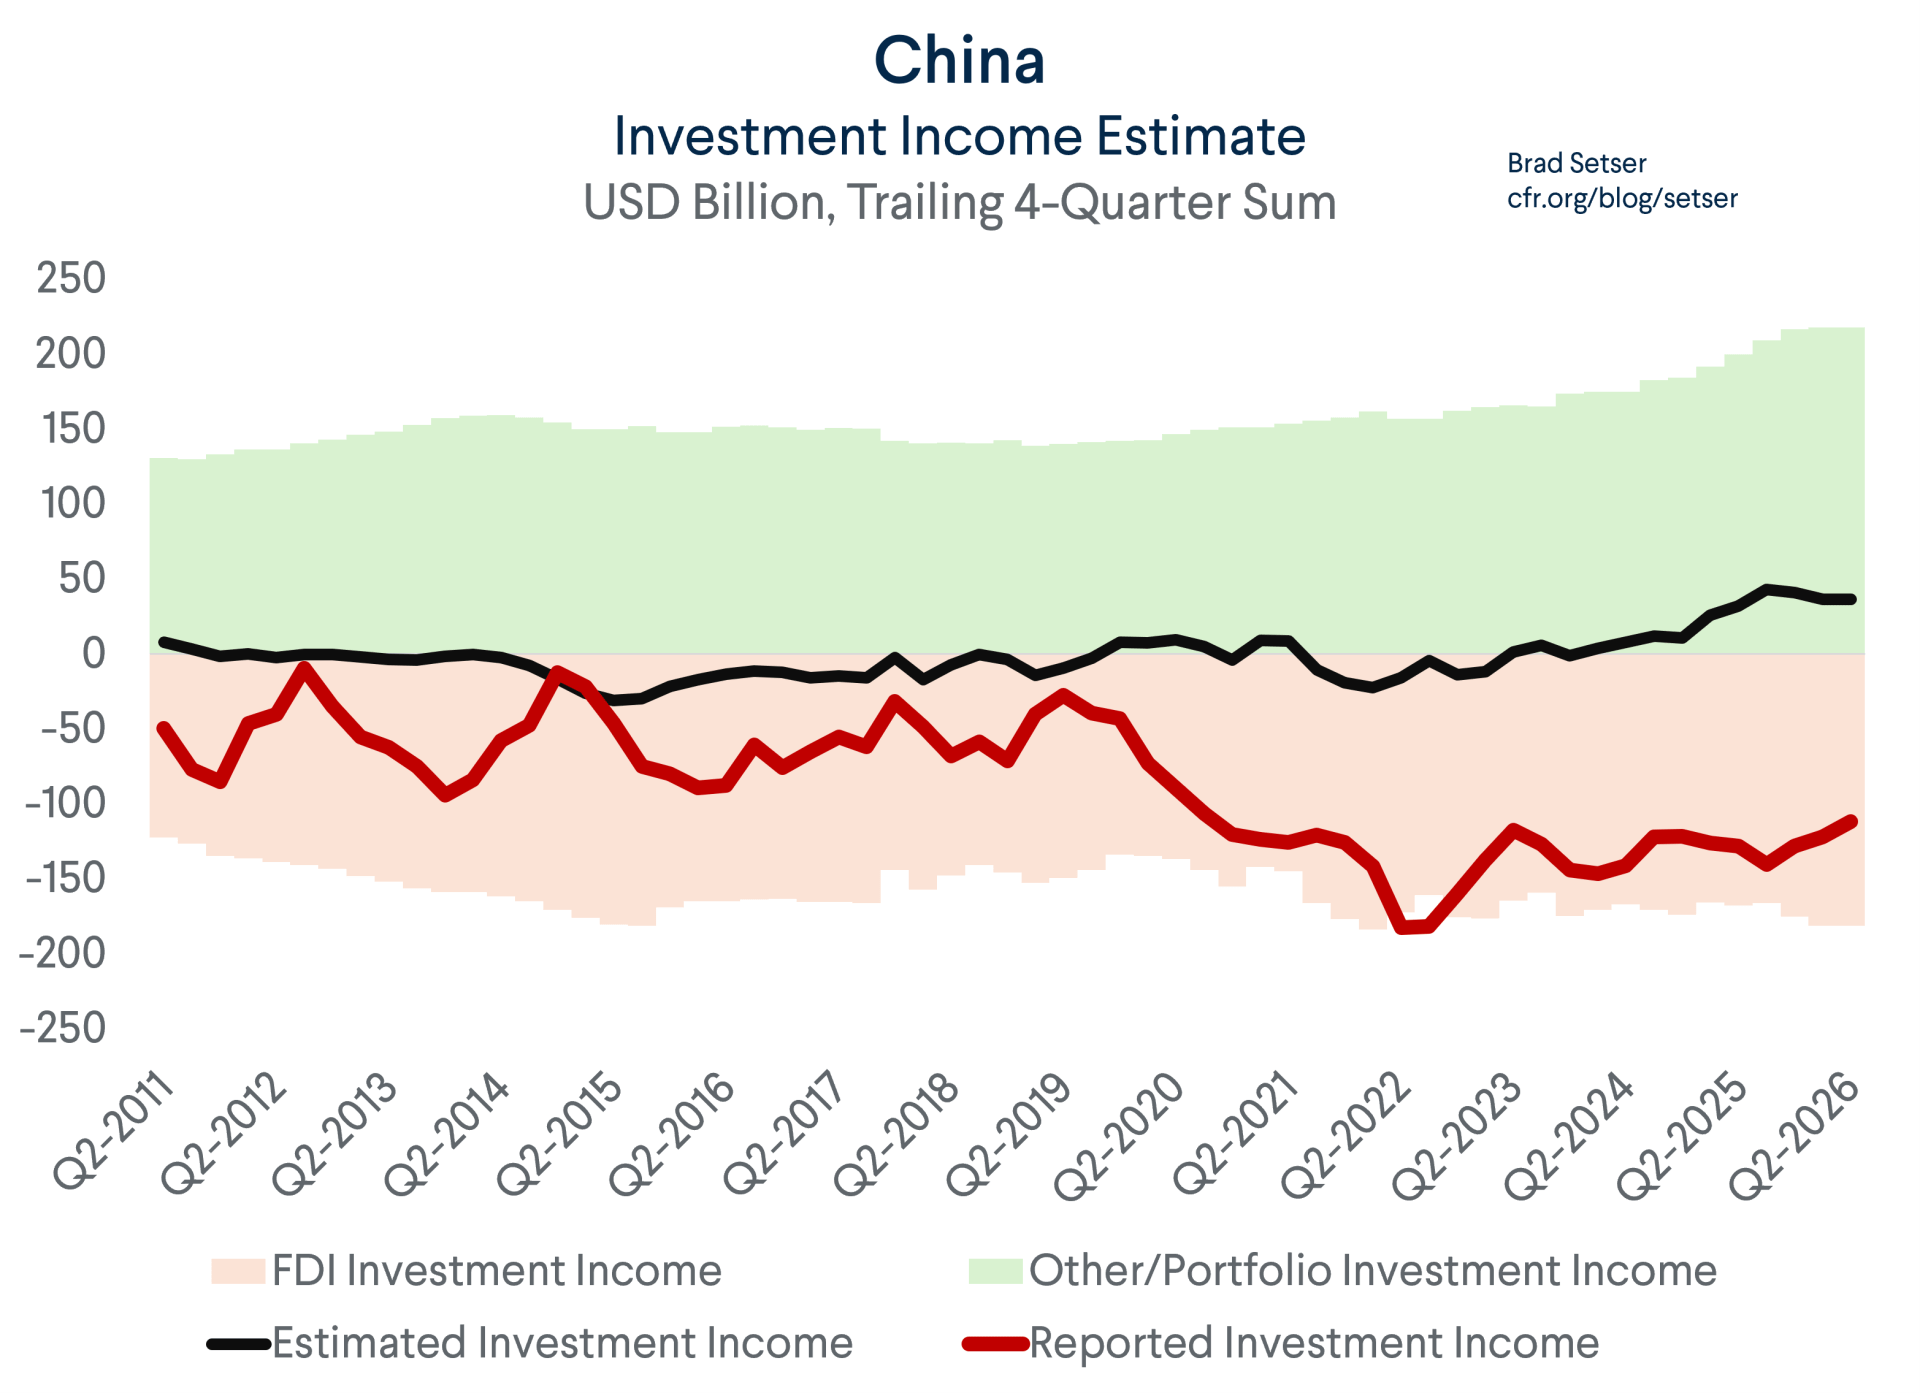
The fact that China reports an investment income deficit of over $100 billion with net foreign assets of over $4 trillion isn’t easily explained. Yes, there can be a difference in return on foreign direct investment in China and Chinese direct investment abroad. But with roughly equal levels of investment in both directions, that gap in returns on direct investment would need to be between 6 and 8 percentage points to offset the $120-160 billion in interest income that would be expected on China’s net holdings of foreign bonds and other interest-paying assets at a conservative 3 to 4 percent interest rate (CDB and state commercial bank loans, if anything, should carry a higher rate, as the CDB lends at a big markup over the U.S. policy rate).
And there is no real evidence that foreign direct investors are earning a ton of money inside China these days. The auto companies certainly are not. Many have abandoned their Chinese JVs, or are using them primarily to supply global markets. The exception—Apple—actually proves the rule. Apple does have a nice business in China. But China’s 2022 statistical adjustments should move Apple’s returns out of the “direct investment” line as Apple’s IP returns accrue to its Irish subsidiary, not its Chinese subsidiary, and into the balance of payments as a small goods deficit.***
The evolution of the investment income line item also doesn’t make any sense. The investment income deficit increased a lot in 2019 and 2020. Certainly, interest rates were low globally in 2020. But that doesn’t explain why the investment income balance remained in a large deficit even after global interest rates soared. The returns on China’s large and growing external loan and bond portfolio should have soared, but they didn’t. That makes no sense.
China in Q1 reported something like a 2 percent return on its foreign bonds and overseas lending. That doesn’t compute, as SAFE eked out a 3 percent return in the low-for-long era after the GFC and can get more than that from a portfolio of five-year Treasury notes and five-year bunds.****
2. China started importing a ton of gold in 2026.
China’s gold imports have gone from around 0.5 percent of GDP to 1.5 percent of GDP in a couple of quarters. That is strange—especially as China’s rising interest in gold came as gold prices fell.
Gold is a strange import. If the gold isn’t going directly to the central bank, it counts as an import even though it is often held as a financial asset. And if the gold is going directly to the central bank, it is counted as the purchase of a financial asset. Some even think SAFE is buying gold through domestic brokers as a means of shrinking the reported surplus. It thus isn’t really controversial to move the gold import line out of the current account and over to the financial account.
3. China started fudging its balance of payments goods number when it changed its balance of payments methodology back in 2022.
That change is now statistically faded into the 2021 data as well.
The changes were in theory an attempt to implement the IMF’s latest guidance (BPM6, which the U.S. hasn’t done). While the IMF has recognized problems with China’s reported investment income deficit, the IMF statistics department hasn’t given an inch on the new goods data, and argues that China, unlike the U.S., has at least tried to follow its statistical guidance.
But China’s actual implementation of the IMF’s guidance was suspect to say the least. I covered this debate in detail a year ago (Apple plays a large role in China’s argument). And the IMF refuses to assess whether the results of the new methodology are really an improvement over the results of the old methodology.
One of the adjustments that SAFE outlined to the IMF back in 2024—the “in China for China” adjustment for firms that don’t have an onshore JV and rely on contract manufacturing—is in principle reasonable. Moving Apple’s profit out of income over to the BOP goods line would be consistent with Apple’s treatment in the Irish balance of payments data, but it should have produced a $20-$30 billion change in the goods number, not a $300 billion change. And moving Apple’s “in China” profit from one line of the current account to another shouldn’t have changed the overall current account numbers.
The other adjustment, which arbitrarily reduces exports in the balance of payments down relative to customs on a never demonstrated claim that contract manufacturers were inflating their exports in the customs data by using a firm’s global wholesale price in customs rather than the amount actually received, simply doesn’t check out. The IMF, to the best of my knowledge, has never looked into the details here either.
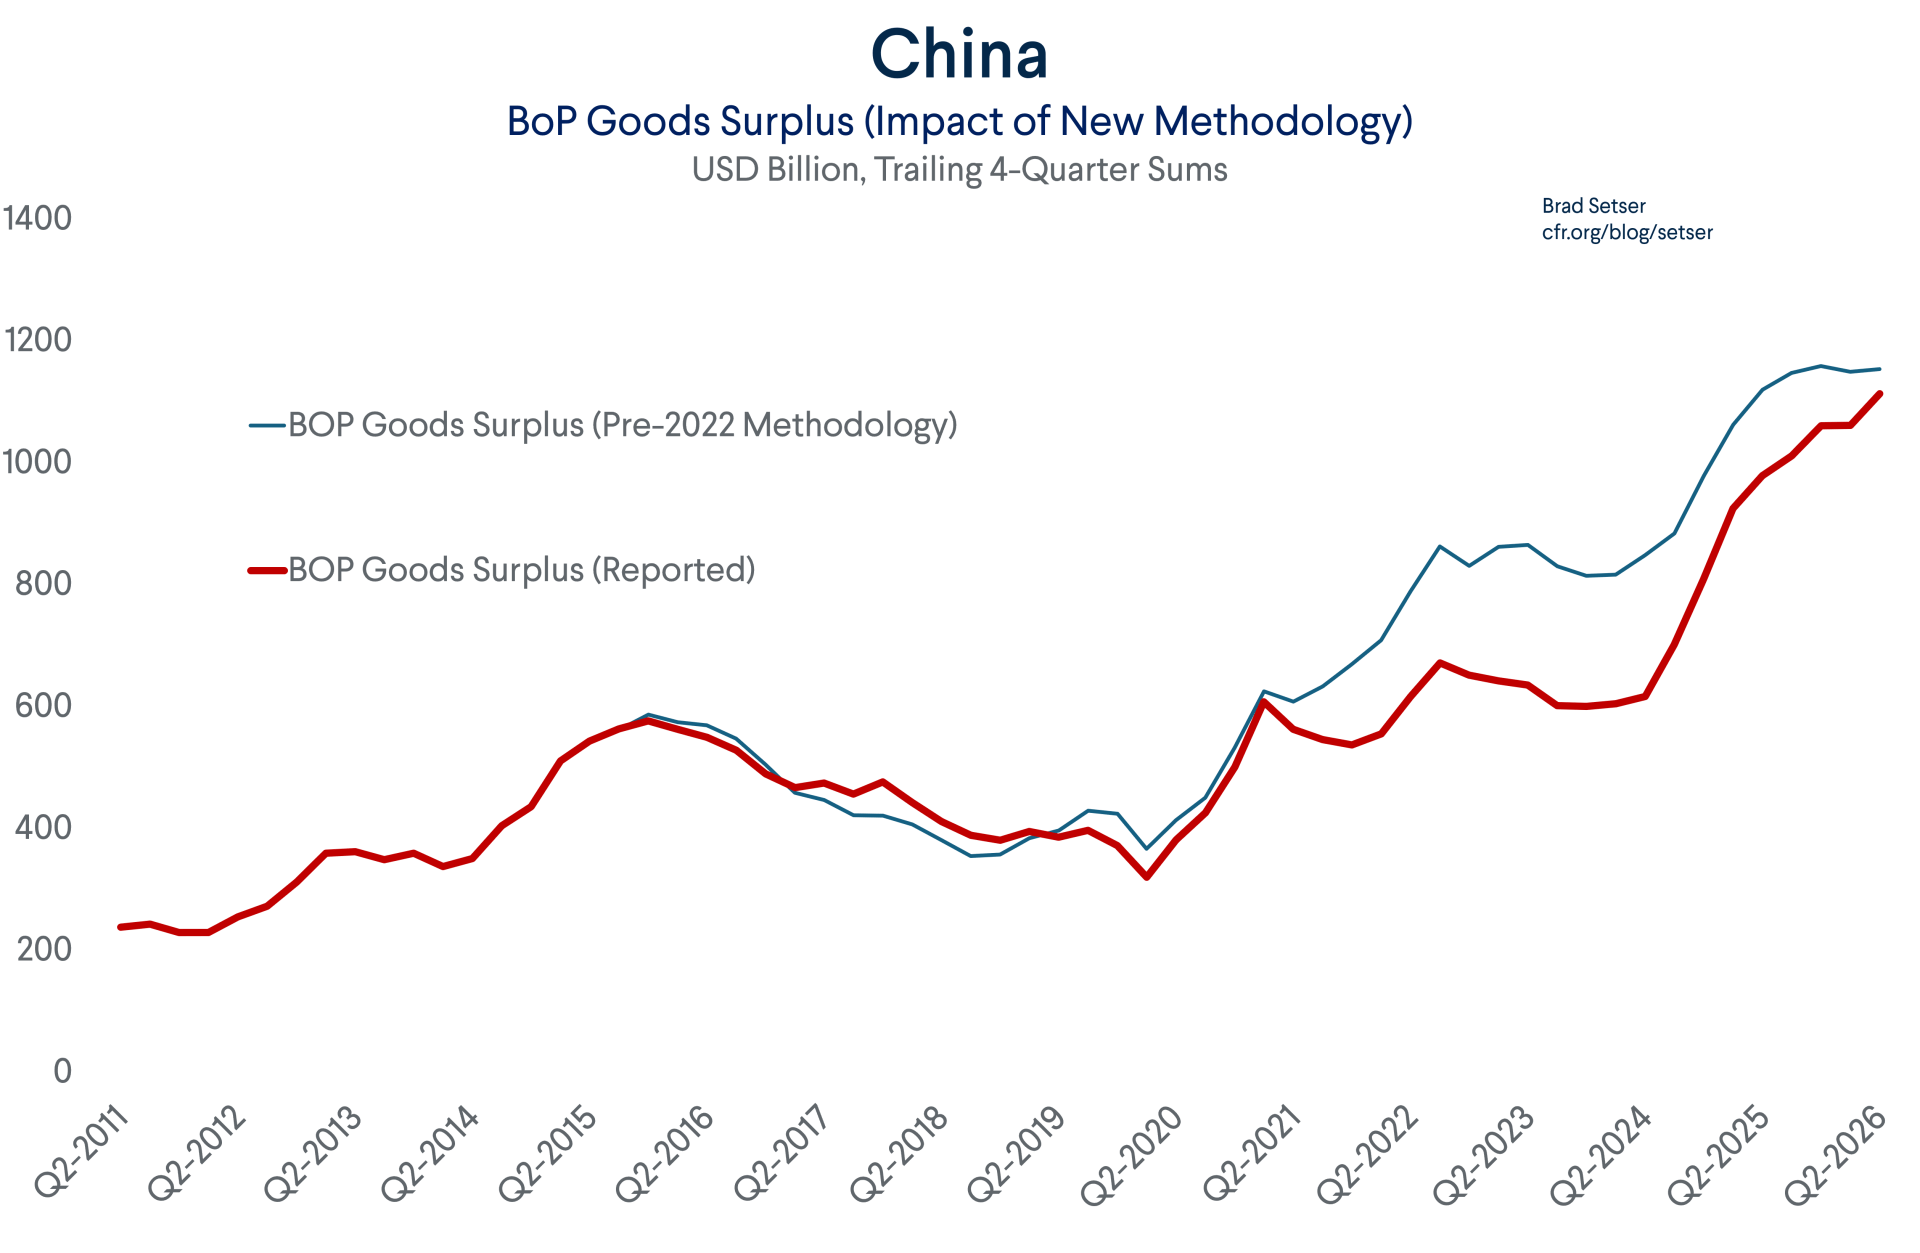
It is relatively easy to construct a consistent time series using China’s pre-2021/22 methodology for calculating its balance of payments goods data (the standard adjustment moves insurance and freight charges over to services). The new methodology, at least until recently, really did lower the goods surplus, and thus the overall current account surplus.
There was clearly a massive downward adjustment to balance of payments goods for a while, without offsetting changes in other lines in the current account.
I was ginned up about this for a while. It really had a big impact on the 2023 and 2024 current account surplus numbers and thus changed the IMF’s overall assessment of China. But—for complex reasons—the impact of this adjustment has shrunk, and it is now less significant than the investment income and gold distortions.***** See the grey and gold bars in the chart below.
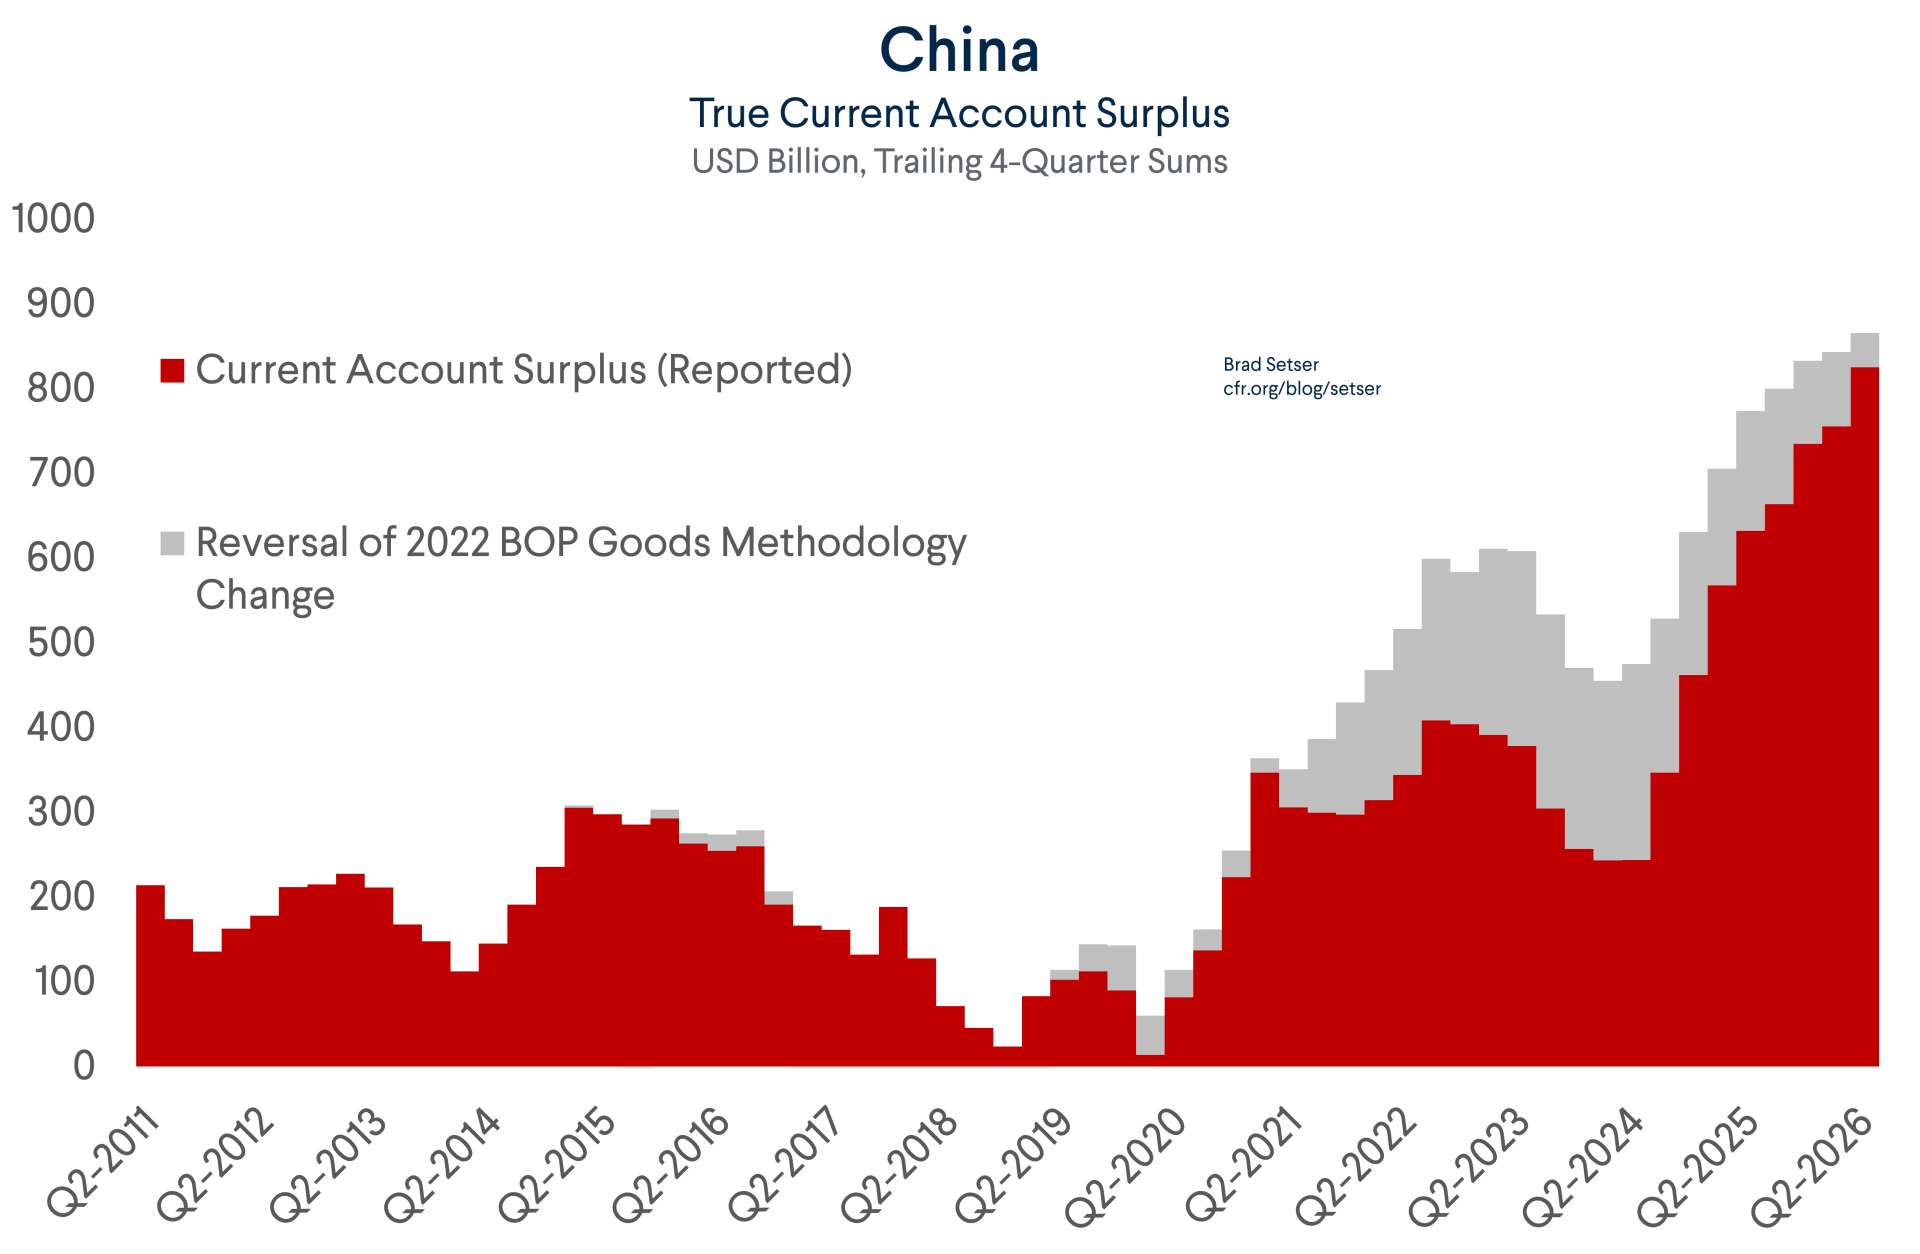
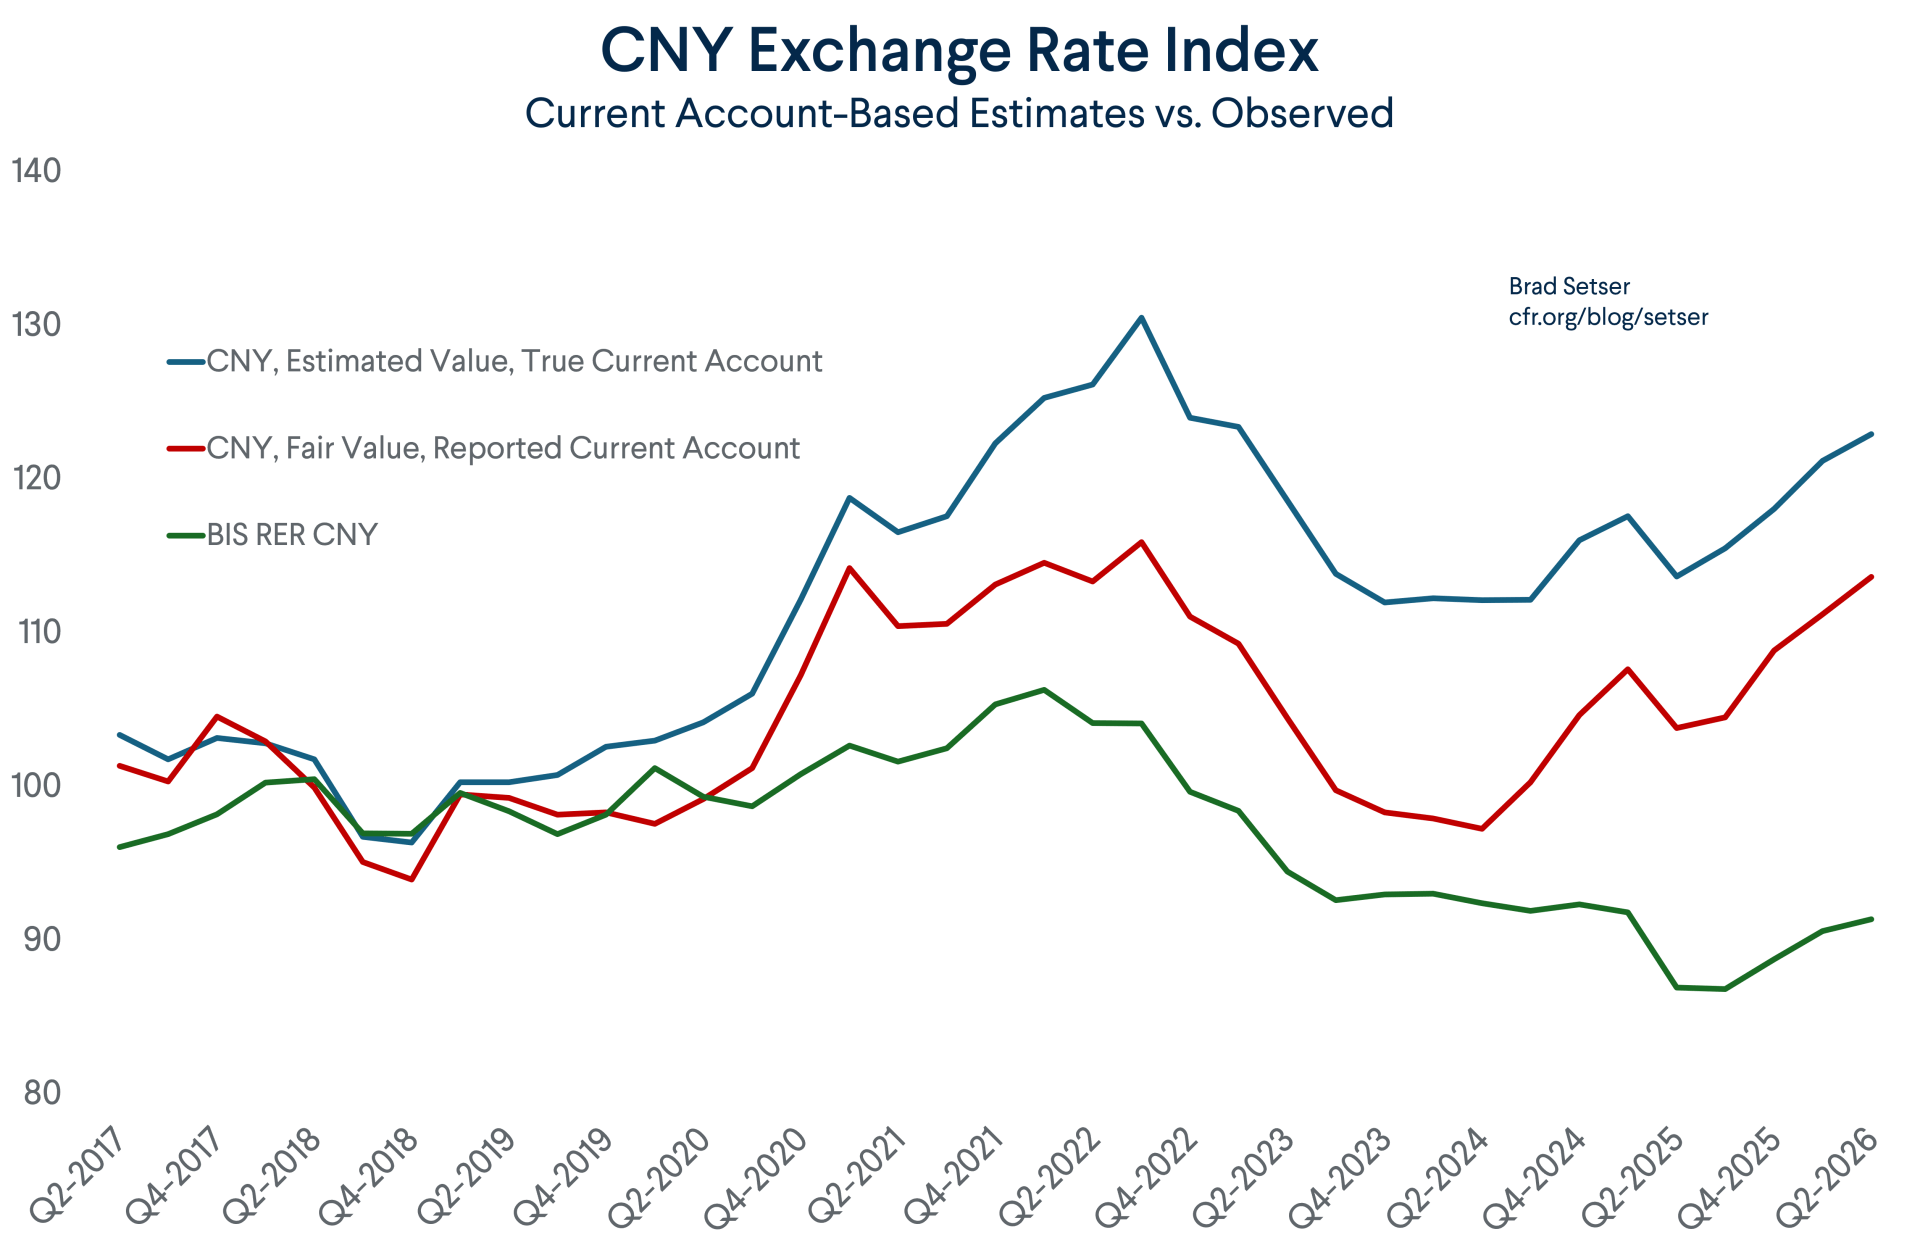
When these factors are taken into account, I estimate that China’s surplus should be around 5.5 percent of GDP—which, without the cyclical adjustment, works out to a 35 percent undervaluation (33 percent, with the cyclical adjustment).
I also used the IMF’s methodology to estimate what the undervaluation should have been in the past (without the cyclical adjustment, as I cannot estimate that reliably).
The larger estimated undervaluation checks out against a range of other indicators.
The Big Mac Index (37 percent undervaluation).
Industry-specific cost comparisons. Greg Ip has a nice chart from Goldman. European auto analysts think China has a 30 percent edge in production costs.
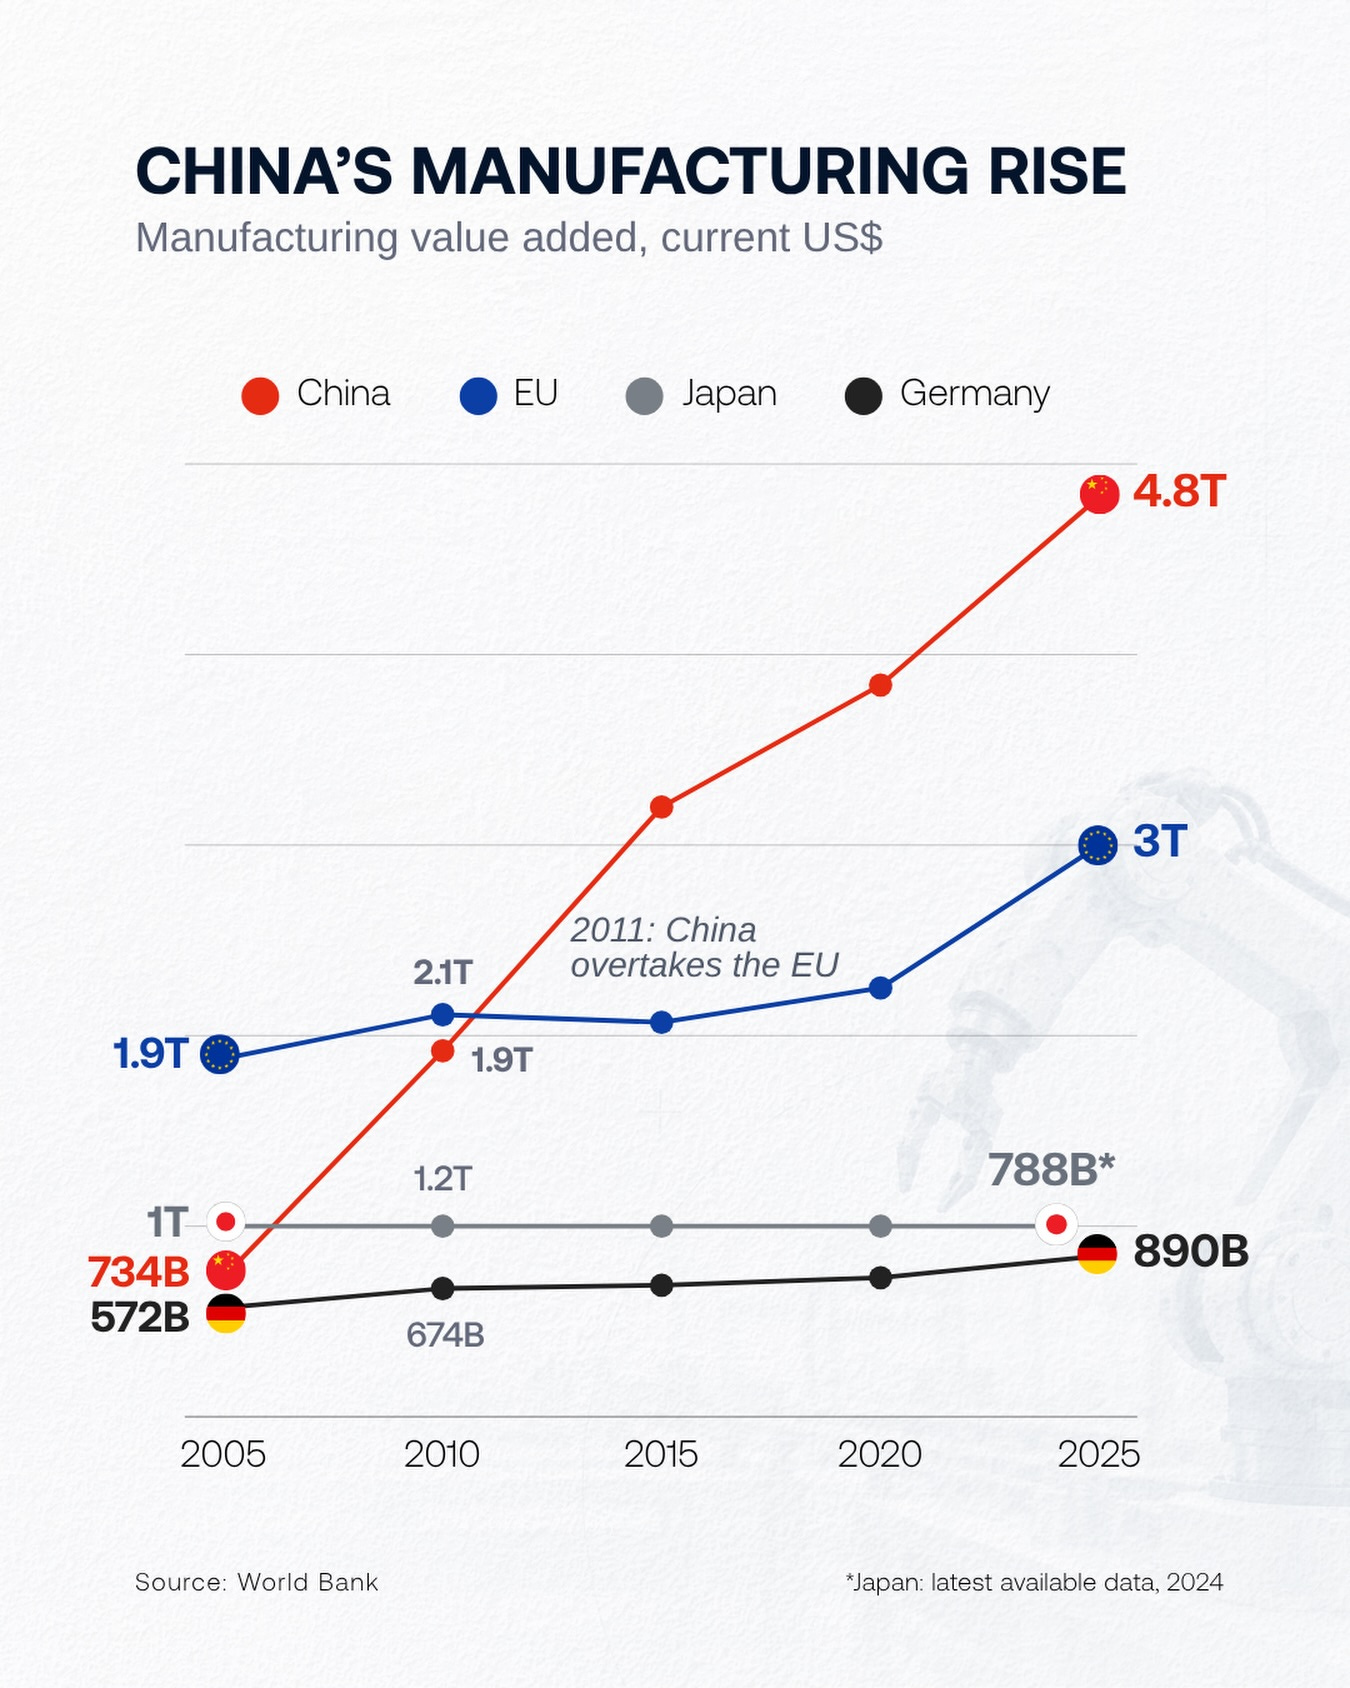
It is also clear in China’s export outperformance relative to global trade. And the breadth of this outperformance.
At the end of the day though, it doesn’t currently matter too much whether the renminbi is undervalued by 20 percent or 35 percent. There is consensus that there is a significant undervaluation.
Fixing that is, by far, the easiest way to address concerns about China’s ever-rising trade surplus—and to get Xi to reconsider China’s growth model and do more to support internal demand.
* Dr. Gopinath observes that the IMF’s current account gap can be closed through a combination of exchange rate moves, domestic policy changes and changes in the international environment (i.e. slower demand growth abroad, slower growth in global trade), not just through exchange rate changes. That is a fair point. Though I would note that there isn’t much evidence over the last 15 years that Chinese demand growth spills over into import demand. Think of an industrial policy for everything. Or, more formally, income elasticity that is way below one. That implies the exchange rate, which does seem to impact export performance more than the IMF believed in the past, will need to do much of the work.
** The customs surplus can (and has been) checked against counterparty data. The travel deficit now broadly maps to observed tourism flows. And the reported NIIP is smaller than it should be given China’s accumulated surpluses. The gross asset and liability position in the IIP data can nonetheless be used to generate an independent estimate of investment income (part of the current account).
*** I agree, for what it is worth. My concern is that China never showed its work, and there isn’t any evidence that moving Apple’s “in China” return over to the BOP goods line items was matched by offsetting adjustments to either the services line (if the “in China” profit was previously counted as a royalty to Apple Ireland) or the income line (if it was previously added to the income line, adding to China’s deficit in FDI income). The current account impact of moving around Apple’s $20 to 30 billion “in China” profit should be zero.
**** The duration on China’s visible holdings of Treasuries is a bit above the norm for reserve managers, and China holds a ton of U.S. Agency bonds (MBS), so it should get an above average return on its dollar reserves. SAFE isn’t particularly risk averse.
***** I would like to think my efforts here had an impact on SAFE, if by nothing else making folks aware that there was an issue. But in reality, SAFE appears to be adjusting the BOP goods line to limit reported errors, and as the renminbi stabilized, settlement conversion increased, and the state banks started adding more to their financial assets, SAFE needed to report a higher current account surplus to map to the larger observed buildup of Chinese assets abroad.
The Renminbi Appears to be Undervalued by 30 Percent | Council on Foreign Relations
China’s official current account data understate the scale of its external surplus and, by extension, the degree of renminbi undervaluation.
 www.cfr.org