G20 Countries Economics Corner

Charted: How Economic Power Shifted Over 200 Years​

Published on August 4, 2026

1785894478685.png

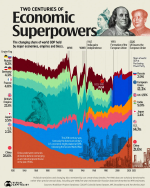
Over the last 200 years, economic leadership has shifted from China to the British Empire, then to the United States, and increasingly back toward Asia.

This streamgraph tracks how the share of global gross domestic product (GDP) held by major economies changed from 1820 to 2025. The visualization incorporates the latest available data from the Maddison Project Database, the COLDAT Colonial Dates Dataset, and the IMF’s World Economic Outlook.

Pax Britannica and the European Years​

Britain was the first country in the world to industrialize. As a result, the British Empire became the world’s preeminent superpower during the 19th century, an era sometimes known as Pax Britannica because of the relative absence of conflict between the major powers.

In 1845, the British Empire, on which the sun famously “never set,” contributed nearly one-quarter (23.8%) of global GDP. India was the empire’s most economically significant possession before gaining independence in 1947.

The table below shows each economy’s peak share of world GDP, the year it reached that level, and its share in 2025:

The rest of Europe’s fortunes followed a similar trajectory. The French Empire reached its peak share in 1858, at 6.6%, while Germany peaked at 8.8% in 1913, on the eve of the First World War.

Following decades of war and declining influence on the world stage, several European economies joined together in the European Union. The bloc contributed 17.9% of global GDP in 2007, ahead of the global financial crisis, though its share later declined and was further reduced by the UK’s withdrawal in 2020.


The Fall of Empire and the Rise of the U.S.​

If the 19th century was the British century, the 20th was the American century. Like Britain before it, the U.S. became the world’s largest exporter for a time.

World War II marked a turning point in global economic leadership. By 1944, the U.S. accounted for 29.7% of world GDP, the highest share reached by any economy in the modern period covered by this dataset.

American economic dominance was supported by high-value industries and the country’s central role in global finance, manufacturing, and trade.

The U.S. also continues to dominate rankings of the world’s largest and most profitable companies today. It also is still the undisputed economic powerhouse in nominal GDP terms.


The Asian Century​

For centuries, China was a center of the global economy. Political instability and its failure to keep pace with European industrialization contributed to a long decline in its share of world GDP during the 19th and 20th centuries.

Beginning in the late 20th century, economic reforms and China’s emergence as a global manufacturing hub helped it regain lost ground. By 2025, China accounted for 21.8% of world GDP, or more than one-fifth of the total.

The full dataset below shows each economy’s share of world GDP for every year from 1820 to 2025:

Together, China and India accounted for 30.8% of global GDP in 2025. Their large populations and lower production costs give both countries greater weight when output is measured using purchasing power parity.

Whether this shift continues will depend partly on how China addresses demographic pressures similar to those facing Japan and the European Union, as well as broader challenges related to productivity and economic growth.


.
@MarkusEconomist
, China does use capital controls to achieve its exchange rate targets and state-owned banks increasingly intermediate China's external surplus but I don't believe, at the current juncture, the evidence is consistent with one sided currency manipulation to prevent the currency from appreciating.

This is in line with the Treasury assessment. China's deflationary context is important to keep in mind when deciding what is the fix. As long as China's policies, including through capital controls and a fiscal policy that does not transfer resources to households, keeps consumption spending low, no simple nominal ER appreciation will generate a decrease in China's net exports. When the shift towards consumption takes place this will appreciate the real exchange rate which then also helps reduce net exports.
@IvanWerning
 

How many times did Economist ever get right on China ? So, it is now saying China's success owes to Communism or Socialism, not anymore like stealing Capitalism from the West, haha.
 
Fed rate cuts triumph over Trump’s economic policies: A defining market battle

By
Amit Pabari
Last Updated: Nov 23, 2024, 01:13:00 PM IST


Synopsis

The Federal Reserve's rate cuts are poised to shape the U.S. and global economies, potentially overshadowing the impact of Donald Trump's economic policies. Despite short-term market fluctuations, the Fed's focus on stability and addressing fiscal challenges is expected to have a more lasting influence on markets, including the USD/INR, EUR/USD, and GBP/USD.​


As the U.S. heads into a new political era following the 2024 presidential election, the financial markets are caught in a fierce tug-of-war between two monumental forces: the Federal Reserve’s ongoing rate cuts and Donald Trump’s potentially disruptive economic policies.

Despite the uncertainties surrounding Trump’s plans, the Fed’s methodical rate cuts appear to be the stronger contender in this market battle, likely defining economic trends well into 2025 and beyond.

The Fed’s Rate Cuts: The Key to Stability
Following a series of bold rate cuts—including a 50-basis-point reduction and a 25-basis-point cut in November 2024—the Federal Reserve remains committed to securing long-term economic stability.

The critical question now is whether the Fed will persist with its aggressive cuts or take a more cautious approach under external pressures, including Trump’s policies.

Several factors point to the likelihood of continued rate cuts:

1. Rising National Deficit​

View attachment 83662
The Federal Reserve's current revenue stands at $3.27 trillion, while its spending has surged to $6.75 trillion, resulting in a significant deficit of $3.48 trillion. With the prospect of Trump returning to power, there are concerns that government spending will increase further, exacerbating the nation’s growing debt. This situation may necessitate a rate cut by the Fed to manage the fiscal imbalance. Additionally, it is striking that the U.S. government is now spending as much on interest payment as it does on critical sectors like defence, Medicare, and healthcare.


2. Soaring National Debt​

The U.S. faces mounting fiscal challenges as national debt surpasses $35 trillion. Debt servicing costs are projected to exceed $1 trillion, prompting the Fed to continue rate cuts to ease borrowing costs. Meanwhile, consumer credit strains are intensifying, with credit card delinquencies hitting 8.8% and serious delinquencies (90+ days overdue) soaring to 11.1% in Q3 2024, the highest since 2011. Credit card debt has reached a record $1.17 trillion, leaving $130 billion at risk of default. These pressures underscore rising financial vulnerability among U.S. households.

3. Bank Losses and Economic Strain​

U.S. banks are under immense pressure, with losses on real estate debt securities soaring to $750 billion—seven times the losses seen during the 2008 crisis. Bank of America alone reported a staggering $116 billion in losses over the past three years. The strain on the financial system is palpable. If these challenges continue, the Fed will likely keep cutting rates to stabilize the banking sector, reduce borrowing costs, and prevent a collapse in the real estate market.

4. Falling Household Savings

View attachment 83665
During the pandemic, Americans saved in record amounts, but by September 2024, households were $291 billion short of expected savings levels. This shortfall is creating a drag on consumer spending.

To combat this, the Fed will likely use rate cuts to stimulate demand, encouraging both spending and investment to prevent further economic slowdown.

Given these challenges, the Federal Reserve’s rate cuts seem set to continue into 2025. Their goal is clear: to stimulate growth, provide
relief to struggling borrowers, and maintain economic stability. Compared to Trump’s economic policies, the Fed’s approach appears more sustainable.

Trump’s Economic Policies: Short-Term Disruption, Long-Term Uncertainty​

Trump’s economic policies—marked by aggressive tax cuts and tariffs—could initially create market excitement, but they are unlikely to overshadow the Fed’s rate cuts in the long run. While tax cuts could spur short-term
investment and bolster the dollar, they come at a steep cost: a widening fiscal deficit and escalating national debt.

This could eventually erode confidence in the dollar, especially as the U.S. grapples with fiscal sustainability challenges. Trump’s trade policies, especially his tariffs on China, may further disrupt global trade relations, potentially triggering inflationary pressures and undermining the dollar’s value.

While the Dollar Index (DXY) may stay strong in the short term, its long-term outlook remains uncertain as trade tensions heighten and alternative currencies gain traction.

Moreover, historically, Trump has not been a champion of a strong dollar. During his presidency, the DXY dropped from 101.50 when he took office in 2017 to 88.12 by the end of 2018, and further to 90.58 when he left office in 2021.

This suggests his preference for a weaker dollar to stimulate exports. As the Fed continues to cut rates, Trump's policies could face growing challenges in supporting the dollar in the long term.

Technical Outlook –

View attachment 83668
On the technical front, the DXY is facing a strong resistance at the 0.5 Fibonacci retracement level around 107.16. A move below this level is expected to push the index toward 103.49. If this support is breached, it could open the door for a decline back to the 100 level.

Fed’s Victory: Shaping the USD/INR and Global Markets​

The continued rate cuts by the Fed are beginning to reshape not only the U.S. economy but also global markets, including the USD/INR currency pair. While the dollar remains strong for now, ongoing monetary easing could eventually weaken the greenback, particularly if investors start questioning the the sustainability of U.S. fiscal policies.

In India, the outflow of $14 billion from equities in October signals broader concerns about rising interest rates and inflation. However, as the Fed’s rate cuts take effect, there may be renewed interest in Indian equities, especially in sectors like information technology, defence, and clean energy.

These sectors, which saw growth during Trump’s first term, could experience a resurgence as investors seek better returns in emerging markets.

Despite the potential risks posed by Trump’s trade policies, India’s economic resilience remains strong. With a trade surplus of $54.7 billion in exports versus $28.5 billion in imports, the U.S.-India trade relationship remains a solid foundation.

Though tariffs may cause short-term disruption, the strategic partnership between the two nations is likely to continue fuelling growth, particularly in areas of mutual interest.

The USD/INR is expected to remain rangebound, likely trading between 83.80 and 84.50, with a slight bias toward the lower end. The interplay of these factors—Fed policy, Trump’s economic moves, and India’s resilient economy—will influence the currency pair in the coming months.

On the global stage, the EUR/USD and GBP/USD are finding robust support at 1.0450 and 1.2550, respectively. These levels are expected to act as springboards for upward movement, with EUR/USD eyeing 1.0800 and potentially reaching 1.10, while GBP/USD targets 1.2850 and possibly 1.3000 in the coming sessions.

(The author is MD, CR Forex Advisors)


IBSA Dialogue Forum​

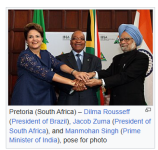
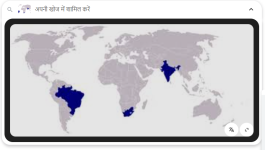
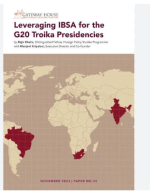
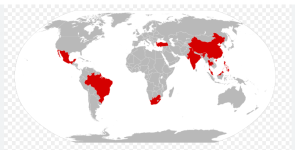
The IBSA Dialogue Forum (India, Brazil, South Africa) is an international tripartite grouping for promoting international cooperation among these countries. It represents three important poles for galvanizing South–South cooperation 👍 and greater understanding between three important continents of the developing world namely, Africa, Asia, and South America. The forum provides the three countries with a platform to engage in discussions for cooperation in the field of agriculture, trade, culture, and defence among others. :coffee:

1785923822345.png
1785923711891.png
1785923571066.png

=>

Newly industrialized country​

Newly industrialized country - Simple English Wikipedia, the free encyclopedia 👍

1785923939457.png
 
How many times did Economist ever get right on China ? So, it is now saying China's success owes to Communism or Socialism, not anymore like stealing Capitalism from the West, haha.

Many economic analisist is swallowed, this is why it is important to use more credible IMF analisis as bench mark.

Many economic analisis published by The Economist, Bloomberg, CNA Asia etc I see has "bias" and "wishful thinking" component and we can see that they try to create negative sentiment for Indonesia for more than one year (since beginning of 2025), foreign investor in stock market just absorb such swallow analisis that later debunked by latest data like investment, consumption data, etc and later credible economic analisis from ADB, IMF, and S&P
 
Last edited:


New! World GDP and GDP(PPP) 1980-2029 / IMF (Oct. 2024 Data)​


G20 GDP, GDP per Capita 1980-2028 / IMF, October 2023 Data​


the GDP on PPP, as in the above post#1, is the true pictures stating the ability to Fire by a certain country, as considered as the very first criterion by the WFP organization as below, :coffee:
🇱🇰🇮🇳
=>
The Global Firepower Index ranks the United States as the world's top military power for 2026 with a score of 0.0741. Russia holds second place, China is third, and India maintains its position at fourth out of 145 assessed nations.


Bond market sell-off sends warning to countries running high debt | DW News​


China Pours Billions Into Mega Banks and Insurers | The China Show | 9/7/2026​


AI Chiefs Call for Slower Model Development​


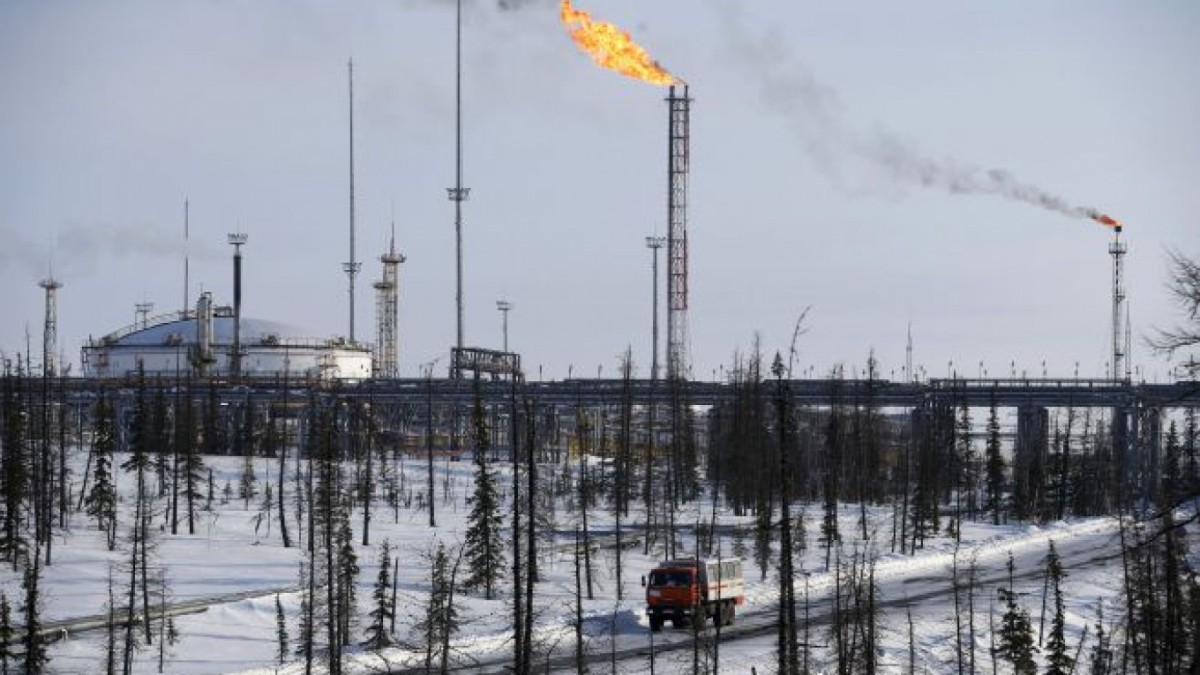
Inside Putin’s $135 Billion Arctic Gamble That Could Save His Ukraine War​


By Simon Watkins - Sep 16, 2026, 4:00 PM CDT

  • Rosneft has launched the giant Vostok Oil project, opening a new Arctic pipeline and shipping its first crude from Bukhta Sever, with output targeted at 30 million tonnes in H2 2027 and 50 million tonnes by 2030.
  • Russia sees the Northern Sea Route as a strategic energy corridor to China, allowing huge Arctic oil and LNG resources to reach Asian markets despite Western sanctions and the loss of Western technology and investment
  • The Arctic is becoming an increasingly important geopolitical battleground, as Russia deepens energy and military ties with China and India while the U.S. strengthens its Arctic security presence to counter Moscow and Beijing.
1789614592493.png

Back in early February 2022, Vladimir Putin had his first in-person meeting with his Chinese counterpart Xi Jinping for nearly two years, at the opening of the Winter Olympics ceremony in Beijing.

To avoid disrupting this landmark event for Xi and to allow China to finalise the multiple hoarding deals for oil and liquefied natural gas (LNG) supplies in which it had been engaged over the previous year, as analysed in full in my latest book on the new global oil market order, Putin had delayed the imminent invasion of Ukraine.

At that meeting, Moscow and Beijing reiterated that there was ‘no limit’ to how far Russian and Chinese friendship may go, and they also announced a slew of huge new cooperation deals in the oil and gas sectors and beyond, including those connected to Russia’s Arctic LNG projects and the Northern Sea Route (NSR). With the relationship between Moscow and Beijing having developed significant limits following several of Russia’s missteps in the Ukraine War, this Arctic Route has become even more important to Putin, and last week saw Russia’s biggest oil producer Rosneft launch its giant Vostok Oil project to this effect.

In addition to the then-current supply of Russian gas and oil through pipelines to China, and future expansion programmes thereof, Putin had been keen back in 2022 to push the idea of more Russian LNG supplies going through the NSR. This had early on been earmarked to serve as the primary maritime highway used by Russia to transport LNG from its remote Arctic extraction plants (including Yamal LNG and Arctic LNG 2) directly to international markets, particularly China.

The Vostok Oil project in Russia’s Far North includes the Vankor cluster, the Zapadno-Irkinsky block, the Payakhskaya group of fields, and the East Taimyr cluster, which overall is estimated to hold proven liquid hydrocarbons reserves of at least 6 billion metric tons (about 51 billion barrels), all within close proximity of the NSR.

Rosneft chief executive officer Igor Sechin had promised Putin before the leader met Xi in February 2022 that the Vostok Oil project and corollary build-out of the NSR would create a ‘new oil and gas province’ on Siberia’s Taymyr peninsula. The complete project was projected at that point to cost RUB10 trillion (then-USD135 billion), including two airports and 15 ‘industry towns.’ According to Sechin, Rosneft’s Arctic developments would eventually produce 100 million tonnes of oil per year (slightly over 200,000 barrels per day), with 30 million tonnes of oil being sent from the Arctic along the NSR between then and 2024 alone.

Last week’s launch of the Vostok Oil project involved the opening of a new pipeline linking the Vankor and Payakha fields with Bukhta Sever, with a design capacity of 100 million metric tons per year. It also saw the loading of first oil onto the Arc7 ice-class Arctic tanker Valentin Pikul at the Bukhta Sever Port on the Kara Sea. Given ongoing sanctions constraints, Sechin said that commissioning the Vostok Oil project will enable the supply of 30 million metric tons of oil as early as H2 2027 and up to 50 million metric tons by 2030. Bukhta Sever Port already has an oil-loading berth, two cargo berths, a port fleet berth, and 14 storage tanks with a capacity of 30,000 metric tons of oil, according to Rosneft.

All this dovetails with the deals signed between Russia and China in early February 2022 that included Rosneft signing an USD80 billion 10-year deal to supply the China National Petroleum Corporation (CNPC) with 100 million metric tonnes of oil over the period, shipped from Kazakhstan to refining plants in Northwest China. This would occur alongside the other exports of Russian crude oil to China already underway, with 2021 having seen Russian crude shipments via pipelines to China total 40 million metric tonnes, according to Russian pipeline operator Transneft.

None of this would affect the continued flow of Russia’s principal crude oil export route to China either -- the 80 million metric tonnes per year that went through the East Siberia-Pacific Ocean pipeline that moved oil directly to China, as well as oil supplies via the port of Kozmino. These figures have always looked well-founded, given that the Russian Arctic’s gas and oil reserves are estimated at around 35.7 trillion cubic metres of gas and over 2.3 billion metric tons of oil and condensate. The majority of these are in the Yamal and Gydan peninsulas, lying on the south side of the Kara Sea.


Users who are viewing this thread

Country Watch Latest

Latest Posts

Back
Top