What’s the real size of China’s economy? China has been lowballing GDP for decades

Beijingwalker

Elite Member
Joined
Nov 4, 2011
Messages
76,545
Reaction score
104,135
Country of Origin
Country of Residence

What’s the real size of China’s economy? China has been lowballing GDP for decades​

World Bank’s latest purchasing power parity GDP survey shows China edging up slightly on US but the measure widely misses the mark
By HAN FEIZIJUNE 17, 2024

– Peter Gabriel
In May, the World Bank concluded one of its periodic International Comparison Program (ICP) assessments – the price survey which “officially” determines purchasing power parity GDP

Like college rankings, the league table of the world’s largest economies shifted just enough for the obsessives to notice while springing no real surprises. Harvard will be Harvard and whether Princeton ranks above or below Yale this year is largely irrelevant.

For the obsessives, China’s lead versus the US expanded by 5.6%, India inched closer to China, Japan kept its ranking while sliding down a tick, Russia moved ahead of Germany, France ahead of the UK, Indonesia tumbled two places and Brazil rose one spot. The top 10 remained the top 10.

While Russia fans can beat their chest over a 13% increase in PPP GDP and the British may fret about dropping out of the top 10, all said, the latest ICP did not produce any remarkable revelations. Nor should it have.

Periodic pricing surveys are necessary to calibrate and maintain the accuracy of PPP adjustments. However, if they result in significant shifts, either too much time has elapsed between surveys or methodologies have broken down.

The ICP is a massive undertaking. According to The Economist, World Bank researchers visited 16,000 shops in China alone to collect price data. The latest ICP assessment collected data in 2021, four years after the 2017 survey. And the conclusion is that China’s GDP was undervalued by US$1.4 trillion pushing China’s 2022 PPP GDP from 119% of the US to 125%.

According to the Economist, China’s National Bureau of Statistics (NBS) was not impressed, downplaying the results stating, “We need to interpret the… results with caution and correctly grasp the global economic landscape and the status of each economy in it” while stressing China remained a “developing economy.” If the NBS did not like such a modest upward adjustment to China’s PPP GDP, it will surely hate the rest of this article.

China’s PPP GDP is only 25% larger than that of the US? Come on people… who are we kidding? Last year, China generated twice as much electricity as the US, produced 12.6 times as much steel and 22 times as much cement. China’s shipyards accounted for over 50% of the world’s output while US production was negligible. In 2023, China produced 30.2 million vehicles, almost three times more than the 10.6 million made in the US.

On the demand side, 26 million vehicles were sold in China last year, 68% more than the 15.5 million sold in the US. Chinese consumers bought 434 million smartphones, three times the 144 million sold in the US. As a country, China consumes twice as much meat and eight times as much seafood as the US. Chinese shoppers spent twice as much on luxury goods as American shoppers.

In 2023, Chinese travelers took 620 million flights, 25% fewer than the 819 million flights taken by Americans, but Chinese travelers also took 3 billion trips on high-speed rail (and 685 million on traditional rail), significantly more than the 28m Amtrak trips.

With the exception of luxury goods, all of the above are volume or unit measurements and need to be adjusted for quality/features to be comparable apple-to-apples. It would be highly presumptuous of us to discount the 16,000 shop visits conducted by the World Bank and accuse them of grossly lowballing China’s PPP GDP.

But that is exactly what we are going to do. It is prima facie ridiculous that China’s production and consumption, at multiples of US levels, can be realistically discounted for lower quality/features to arrive at a mere 125% of US PPP GDP.

It’s not that we think the World Bank has done a bad job. It’s that we believe China’s NBS, contrary to popular opinion, has been lowballing GDP for decades and the World Bank has to work within the confines of the NBS’s reported data. This was politically important decades ago for WTO concessions and it is politically important today to maintain developing economy status as China makes a play for leadership of the Global South.

We believe China’s GDP and PPP GDP are lowballed by an incomplete transition from the Material Product System (MPS) of national accounts, which excludes services by design. The World Bank is likely dutifully doing its sums with goods consumption in China multiples of the US but measuring services consumption as a fraction of the US.

The United Nations System of National Accounts (UNSNA) provides voluntary guidelines and specifically states that nations should base their national accounts on local conditions. What that has meant in the West is to adopt all UNSNA “innovations” introduced over the years.

Items like imputed rent, legal fees and R&D are now all included in GDP. The UK went hog wild with both illegal drugs and prostitution as now part of their GDP because… hey, why not? UNSNA’s 2008 guidelines explicitly recommend that illegal market activity should be included in GDP.

China’s NBS stood its ground on a conceptual level. Rightly or wrongly, the Leninist MPS considers services necessary costs of material production rather than real value creation. In China’s first attempt at converting MPS to SNA in 1985, it tacked on a ludicrously low 13% to the MPS number and called it China’s services GDP.

Over the years, the World Bank has twisted the arm of the NBS for modest increases to China’s services GDP – with limited success.

The affordability crisis in Western economies, the US in particular, is largely driven by inflation of necessary services – rent, healthcare, education and childcare – not by manufactured goods. While these costs have also gone up in China, they have increased less and much are left out of GDP anyway.

Also not captured by the ICP survey conducted in 2021 are the price and service wars that have broken out across industries and products – a bane on businesses but a boon for consumers.

This is most visible in China’s car market with OEMs either cutting prices to the bone (Hyundai Sonatas down to $17,000 from $42,000) or offering cutting-edge technology for peanuts (a 2,000-kilometer range BYD Q plug-in hybrid electric vehicle for $14,000). The price of solar panels fell 50% in 2023 and continues to trend down in 2024. CATL has announced plans to cut lithium-ion battery prices in half by the end of 2024.

Restaurants are offering white glove perks like hot towels, lotion by the sink and snazzy remodeled decors. Hairdressers hand out bottled water and fruit plates. Tech companies have slashed large language model (LLM) prices to basically free. Service quality in China, impossible to quantify, is now head and shoulders above the West and probably even Japan.

Adherence to UNSNA has caused a breakdown in the meaning of GDP. As necessary services become an ever larger share of Western economies, their growth does not appear to result in discernable improvements in living standards.

Are US healthcare and universities twice as good as they were in the year 2000? If US households have not gotten vastly improved healthcare, education, housing and childcare over the past two decades, then inflation has been systematically underreported and GDP growth may have, in fact, been less than 1% per annum (instead of 2%), which equals stagnation given 0.8% per annum population growth. This may go a long way in explaining popular anger and the meltdown of American politics.

China’s material-focused GDP may be a better measure of the economy as it relates to living standards, especially since UNSNA has obviously lost its mind by now officially recommending drugs, prostitution, illegal gambling and theft be included in GDP.

Western defense analysts are onto something when they come up with wildly inflated estimates for China’s defense spending. But it’s not China’s defense spending that is lowballed – it is Western defense spending, especially by the Pentagon, which needs to be reassessed.

Somehow the $1 trillion a year the US devotes to defense (including intelligence and Energy Department programs) has caused the US Navy to shrink while China’s $236 billion budget has built the world’s largest navy by ship count.

Similarly, analysts who lament that China accounts for 30% of the world’s manufacturing output but only 13% of household consumption are far off the mark. China accounts for 20-40% of global demand for just about every consumer product but much of the services it consumes have been left out of national accounts.

So how much is it? How big is China’s economy really? About six months ago, this writer estimated that China’s GDP needed to be grossed up by 25-40% to be on a UNSNA basis.

But after shopping for cars, buying a domestic brand carbon fiber road bike with all the bells and whistles for $2,600 (equivalent to a $15,000 Trek), paying $7.65 for Bluetooth earphones (much better than the $250 PowerBeats Pro they replaced), renting cars for $20 a day, staying at boutique hotels for $30 a night, buying an extremely solid heavy duty umbrella for $2.20 (and losing it right away) and undergoing an unfortunate series of medical interventions (both major and minor) for less than the deductible on expat health insurance and getting white glove customer service for the smallest of purchases, Han Feizi’s mental map of price and value has crumbled.

No, the ICP did not do a lousy job. They were hamstrung by the initial conditions that China’s NBS subjected them to. And the data released in 2024 was taken in 2021 – ancient history in China. The recent ICP adjustment of a few percentage points in China’s PPP GDP relative to the US elicited consternation from the NBS.

But the reality is an accurate adjustment would be of a multiple or two.


Cars are loaded onto a ship for export at a port in China.

image: getty images
Dec 14th 2023

China’s current-account surplus was once one of the most controversial statistics in economics. The figure, which peaked at almost 10% of gdp in 2007, measures the gap between China’s earning and its spending, driven largely by its trade surplus and the income it receives from its foreign assets. For much of the past two decades, China’s surpluses have left it open to the charge of mercantilism—of stealing jobs by unfairly boosting its exports. Some trading partners now worry about a similar shock if the country’s output of electric vehicles grows too quickly.

But China’s current-account surplus is now modest: $312bn or 1.5% of gdp over the past year, according to the country’s State Administration of Foreign Exchange (safe). That is below the 3% threshold that America’s Treasury deems excessive.

Is the figure reliable? Some, such as Brad Setser of the Council on Foreign Relations and Matthew Klein, a financial commentator, believe that the official numbers are dramatically understated. China’s true surplus, Mr Klein reckons, is now “about as large as it has ever been, relative to the size of the world economy”. They offer two arguments. First, China may be understating income from its foreign assets. Second, it may be understating exports.

According to safe, the income China earns on its stock of foreign assets plunged from mid-2021 to mid-2022. This seems odd given rising global interest rates. Mr Setser’s alternative estimate, based on assumptions about China’s assets, would add about $200bn to the surplus.

China’s goods surplus also appears smaller in safe’s figures than it does in China’s own customs data. The gap was $230bn over the past year. “That is real money, even for China,” says Mr Setser.

China might take some comfort from a bigger surplus. But it has an unsettling implication. What is happening to the additional dollars China is earning? Since they are not showing up on the books of China’s central bank or its state-owned banks, they must be offset by a hidden capital outflow. Such outflows typically end up in a residual category of the ledger. Mr Setser believes this residual should be about 2% of gdp, not the official figure of near zero.

20231216_FNC975.png


image: the economist

safe has a different explanation. It attributes the export gap largely to China’s free-trade zones and similar enclaves. These lie inside China’s territory but outside its official tariff border (see diagram). Goods leaving these enclaves for the rest of the world are counted as exports by customs but not by safe. Adam Wolfe of Absolute Strategy Research points out that these zones account for a growing share of China’s exports. That may explain why the gap has emerged only in the past two years.

Mr Setser is unconvinced. If China’s free-trade zones have enjoyed a dramatic export boom, it should produce ripples elsewhere. Wages earned by workers, for example, should appear as increased remittances. In fact, they have risen only a little. And as Mr Wolfe points out, even if the official current-account surplus is correctly calculated, it may be of little comfort to China’s trading partners. After all, if the country’s domestic demand remains weak, goods made in its free-trade zones may flood foreign markets. The rest of the world will count them, and experience them, as Chinese imports, even if safe does not count them as Chinese exports.


China Has $3 Trillion of ‘Hidden’ Currency Reserves

  • Lack of transparency in China is a problem for world: Setser
  • Nation’s official reserves have flat-lined over recent years
ByCormac Mullen
June 30, 2023 at 11:05 AM GMT+8

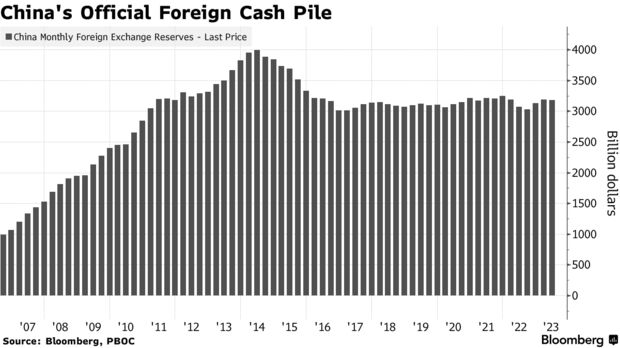
China is sitting on a $6 trillion pile of money, half of which is “hidden,” and that presents a new kind of risk to the global economy, according to Brad Setser.

A lot of the country’s foreign-exchange reserves don’t show up in the official books of the People’s Bank of China, the former US trade and Treasury official wrote in a report on The China Project, a New York-based news platform. Instead, what can be called “shadow reserves” appear among the assets of entities such as state commercial lenders and policy banks, Setser said.

A lot of the country’s foreign-exchange reserves don’t show up in the official books of the People’s Bank of China, the former US trade and Treasury official wrote in a report on The China Project, a New York-based news platform. Instead, what can be called “shadow reserves” appear among the assets of entities such as state commercial lenders and policy banks, Setser said.

While official reserves have flat-lined over recent years, the “hidden” variety have likely pushed higher alongside China’s export surplus, he said.

China's Official Foreign Cash Pile


“China’s lack of transparency here is a bit of a problem for the world,” Setser wrote. “China structurally is so central to the global economy that anything it does, seen or unseen, will eventually have an enormous impact on the rest of the world.”

The State Administration of Foreign Exchange didn’t immediately respond to a request for comment.

An example of the influence China’s reserves can have is their role in funding the country’s Belt and Road Initiative, which stemmed from a post financial-crisis push to diversify holdings, according to the former Biden administration trade adviser.

“They are powerful enough of an economic force such that an entire, global, decades-long infrastructure plan was in some ways, just a side effect of a 2009 decision to find new ways to manage China’s foreign exchange,” he wrote. “Well, China is so big an economy – and such an unbalanced economy – that all its activities just have an outsized global impact.”

Institutions reporting to the central government probably have closer to $6 trillion in foreign assets, Setser said. That compares with the $3.1 trillion in official reserves SAFE reported at the end of last year, he said.

Setser is now a senior fellow at the Council on Foreign Relations, a New York-based think tank.

The scale of these hidden reserves “highlights an important fact that is often forgotten amid all the talk of China’s domestic debt problems,” he wrote. “Globally China is still a massive creditor, and the weight of China’s massive accumulation of foreign exchange is still felt around the globe.”


China's Current Account Surplus Is Likely Much Bigger Than Reported​

The IMF needs to focus on China’s external account in its surveillance. The reported current account surplus appears to be significantly too low.
Blog Post by Brad W. Setser
November 21, 2023 11:05 pm (EST)

China’s financial account is interesting, and not well understood.
China’s state didn’t stop accumulating foreign assets when it stopped adding to its reserves – though with dollar rates now above Chinese rates, China is now drawing on, rather than adding to, its shadow
But China’s current account also isn’t quite what it seems.

Customs v BoP Current Account Surplus


The current account is the sum of the goods balance (a big surplus for China), the services balance (a modest deficit now thanks to renewed tourism flows), and the balance on investment and labor income (technically now in deficit thanks to a reported deficit in investment income).

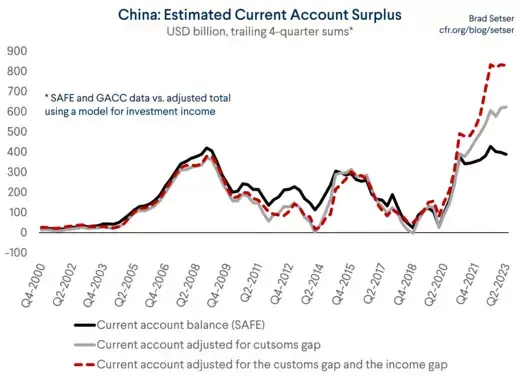
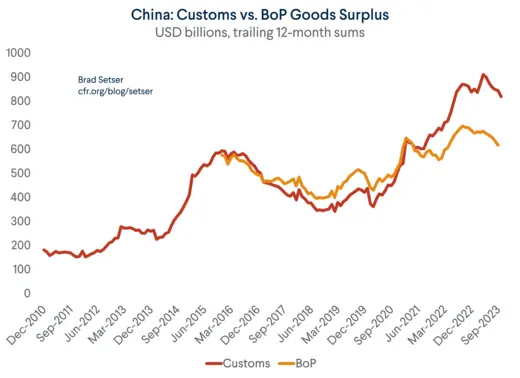
Both the goods surplus, which is much smaller in the balance of payments than in the customs data, and balance on investment income, which remains in deficit even with the rise in U.S. interest rates, are suspicious. With reasonable adjustments, China's “true” current account surplus might be $300 billion larger than China officially reports. That's real money, even for China.

China’s goods trade surplus has more than doubled since the pandemic, going from $400 billion a year to $900 billion. All else equal, the current account surplus should have increased in tandem.

Moreover, the rise in the customs surplus data makes economic sense: China's trading partners provided a lot of support to their consumers to keep household income up during the pandemic, while China did not. China's GDP data shows that China has generated at least (three!) percentage points of growth from net exports since the end of 2019. That is a lot; net exports typically aren't a big source of growth for large economies (imports and export rise in parallel most of the time). But the rise in net exports in the GDP data and the rise in the customs trade surplus just doesn't show in the current account data.

China Estimated Current Account Surplus


Alex Etra of Exante data has shown that the mirror image data from China’s trade partners tells practically the same story. China is running a much bigger surplus with Europe, for example. China’s deficit with its chip supplying neighbors is also down. There also hasn’t been much change in China’s reported surplus with the U.S., even with the Trump tariffs, in the Chinese customs data.*

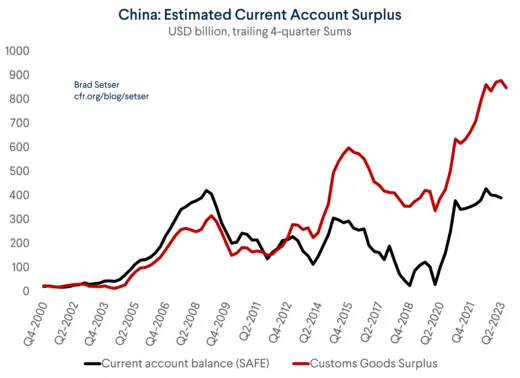
So, the customs surplus does really seem to be just under $850 billion.

That surplus mysteriously falls to just under $620 billion in the balance of payments data.

China Customs vs. BoP Goods Surplus


There are some small technical differences between the customs data and the balance of payments data. For example, the balance of payments data for imports should be a bit smaller than in the customs data, as the cost of insurance and freight is moved over to the services account (for a long time this was just a 5 percent shift from goods to services).

However, that adjustment actually raises the goods surplus in the balance of payments data. It thus doesn't explain why the balance of payments surplus in goods is smaller than the customs surplus in goods.

Similarly, merchanting (a Chinese firm buying a U.S. good and selling it in Europe without moving it through China’s customs border), should raise China’s surplus in the balance of payments data. Chinese oil companies bought the rights to U.S. liquefied natural gas (LNG) a long time ago, and often have sold the actual LNG directly to Europe or elsewhere in Asia rather than shipping it to China.

Historically, the two series have lined up well. They only started to diverge in 2021.

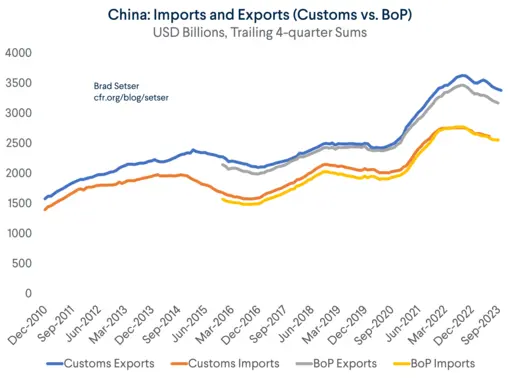
China: Imports and Exports (Customs vs. BoP)


China has argued that exports from foreign companies operating in bonded zones (geographically in China but technically outside of China’s legal border for tariffs and tax) should not be counted as Chinese exports (Apple’s main manufacturing subcontractor operates in one such bonded zone, and so on). But in that case, imports into bonded zones also shouldn’t appear in the balance of payments data, and Chinese parts sold into the bonded zone should count as exports.
It gets a bit complicated, but China's explanation (here) doesn't really make sense.

The obvious point here is that the gap between the customs numbers and the numbers in the balance of payments only emerged recently, and nothing about the operations of foreign firms in the bonded zones obviously changed in 2020 or 2021 to account for a sudden change.

The best possible explanation is from Adam Wolf. He adjusted for Chinese exports from free trade zones (one form of bonded zones in China's terminology) and argued that a surge in exports from free trade zones may account for the increased discrepancy in 2021.

I am not convinced. If exports from free trade zones are taken out because the bonded zones are legally outside China, there should be an offsetting fall in imported parts. But imports are up in the balance of payments data not down. Now goods produced in the bonded zones and then sold into China would technically be imports (China would be importing from itself in some sense, but not in a legal sense because the bonded zones are legally offshore). So the argument needs to be that there are offsetting adjustments to "onshore" imports, and a certain share of customs exports are technically produced by foreign firms in areas of China that are legally offshore and thus don't enter in the balance of payments. China as Ireland so to speak.

But it is still hard to understand how this generates a big adjustment to the overall current account.

If the trade accounts are being fully adjusted to take free trade zones out of the data, there should be some offsetting changes elsewhere. For example, all the wages paid to Chinese workers in the special customs zone should be considered exports of labor services to foreign multinationals operating offshore, which would register as an increase in the labor income of Chinese residents in the income balance (Chinese factory workers who work in the bonded zones technically would be earning income outside of China per the accounting). The net effect of all the offsetting adjustments on China's overall balance should be zero – and it clearly has not been.

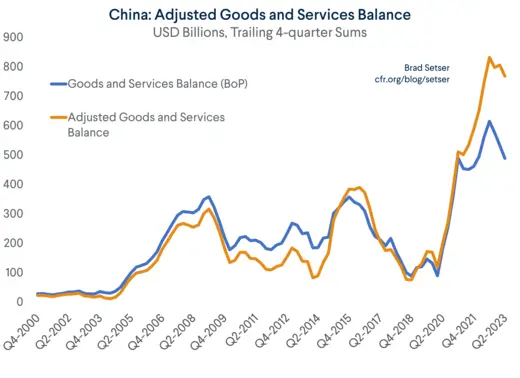
The sums involved are big, and the data just doesn't quite add up. China has not provided a convincing explanation for why the gap emerged recently, nor a detailed account of the precise adjustments it now makes for the bonded zones. If the gap between the reduced goods surplus in the balance of payments and the underlying customs data is removed from the reported numbers, China's goods and services surplus would be way up.

China: Adjusted Goods and Services Balance


Now the investment income balance.
Investment income is the income China receives on its investment in foreign bonds, the interest it gets on its foreign lending, and the dividends paid back to China by the offshore operations of Chinese firms net of the interest China pays on its external debt and the dividends foreign firms operating in China pay back to their parents.

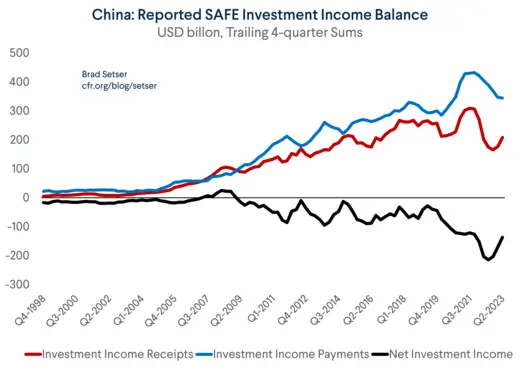
China's investment income deficit increased significantly during the pandemic – and that deficit has remained even as dollar interest rates appear to have moved in China's favor. China, remember, holds a lot of dollar bonds, and its state banks have lent out a ton of dollars.

Reported SAFE Investment Income Balance


China doesn’t provide any underlying detail here in the balance of payments data, which is a problem in itself. Obviously China is trying to make it hard to estimate the interest income on its reserves, but that practice has persisted even though income on China's formal reserves no longer dominates the data. And China is too big (and too important globally) to get a free pass on basic economic data for much longer.

Let’s go through the math to illustrate why the persistence of the income deficit is a bit of a puzzle. Matt Klein agrees, by the way.

Start with the basics. China has over $3 trillion in foreign exchange currency reserves. $3.25 trillion, in fact, if the state banks’ required reserves held at the State Administration of Foreign Exchange (SAFE) are counted. The total would be a bit higher if gold and China's IMF position were added in.

The state commercial banks have roughly another $1 trillion in net foreign assets (a mix of loans, offshore deposits, and investments in foreign bonds).

The state policy banks hold another $1 trillion or so in loans. This, sadly, isn’t transparently disclosed, but it is implied by the net $2.5 trillion in Chinese bank assets abroad that China reports to the Bureau of Industry and Security (BIS) – and it is also a sum consistent with Aid Data's detailed (and very impressive) forensic work.

So, to simplify, let’s just take the BIS number for the banks foreign assets (around $2.5 trillion). Adding that sum to reported reserves and the funds the banks hold at the PBOC leads to an estimate that China has around $5.75 trillion gross foreign reserves and interest-paying assets.

China has borrowed about $1.5 trillion dollars from the world. And it also pays interest to foreign investors on about $700 billion of foreign holdings of Chinese yuan bonds.
 
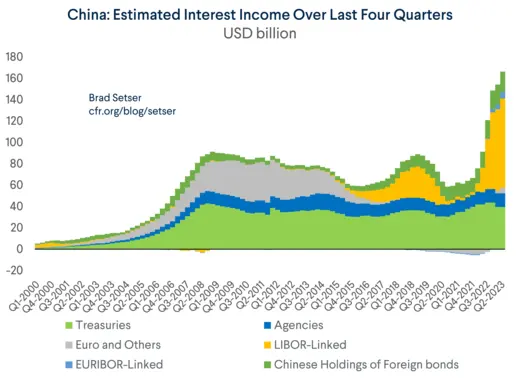
China therefore has, on net, a little over $4 trillion in foreign currency assets abroad. It should be making over 3 percent on those assets. Possibly close to 4 percent (China has been buying high-yielding Agencies, and the policy banks often lent at LIBOR + 300).

China: Estimated Interest Income Over Last Four Quarters


The ballpark math: 3 percent works out to over $120 billion in interest income a year; 4 percent comes in at $160 billion. Net out the $20 billion or so China pays every year on foreign holdings of yuan bonds ($700 times 3 percent) and China should have a surplus in interest income of $100 billion to $140 billion.

China, of course, could still run a deficit on investment income if it pays a ton more on foreign direct investment inside China than it earns on its (more limited) direct investment abroad.

The obvious test though isn't possible as China only reports data the total investment income payments and receipts. There simply is no separate line item for dividends, so interest income cannot be directly inferred from China's reported numbers.

The data that China reports does show an overall deficit in investment income in the last 4 quarters of data of around $200 billion.

So, given the reported total deficit and the estimated surplus in interest income, the overall numbers work only if there if foreign investors in companies in China generate about $300 billion more in income than Chinese companies generate on their investment abroad.

Let's dig a bit deeper: China reports that Foreign direct investment in China is about $3.4 trillion and Chinese direct investment abroad is about $2.8 trillion. That isn't a huge gap. The large net outflow of investment income would only happen if foreign investment in China is wildly more profitable than Chinese investment abroad.

Is that kind really plausible when China’s economy has slowed and the property sector is in the doldrums?

To be sure, there is a roughly $1 trillion gap between reported portfolio equity investment in China and Chinese portfolio equity investment abroad. But dividend income on most stocks tends to be modest, so that alone isn't likely to generate a $300 billion deficit on equity investment income dividends.

The numbers here don't seem to work. The gap in dividends paid on equity investment just seems too big.

But what is really hard to explain is that the reported offshore investment income, including interest income, has tumbled since the end of 2021.
That makes no sense.

Remember that most of China’s offshore assets are in dollars, and a large share are now linked to short-term interest rates. Dollar rates are obviously up over this period.

To help calculate what China's investment income should be, it helps to construct a simple model. The model itself isn't fancy, but I think it breaks a bit of new ground. It at least provides a baseline for assessing China's reported data.

China's interest income on its reserves can be estimated using the latest reported data on the dollar share of its reserves, with the assumption that China's interest payments on its Treasury (and Agency) holdings map to the average paid to all foreign investors.

Let’s assume China receives the interbank dollar rate (LIBOR) on most its external lending. I assumed that 90 percent of China's external loans are in dollars and only 10 percent are in euros, consistent with the Aid data analysis. Obviously some Chinese loans are on more concessional terms, but some are also at a substantial premium to LIBOR. Using LIBOR is thus just a best guess to offset the lack of reported data.

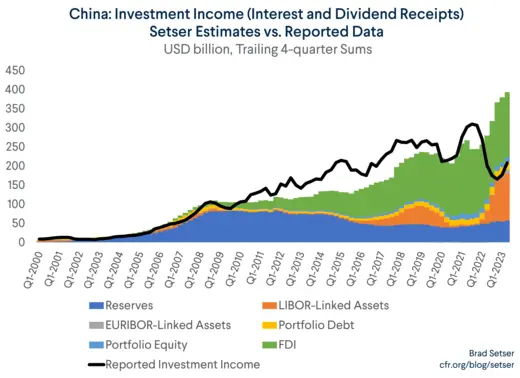
China Investment Income Setser Estimates vs. Reported Data


I also assumed, based on a back fit with reported data. that foreign direct investors are getting a return of 8 percent on their investments in China.
The model more or less works up until about 2021. If anything, it underestimates China's investment income over time.

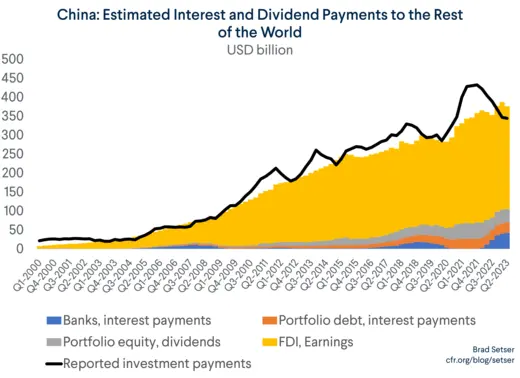
China: Estimated Interest and Dividend Payments to the Rest of the World


It gets foreign income on foreign investment in China more or less right (by construction, as I raised the estimated FDI yield to get a match).
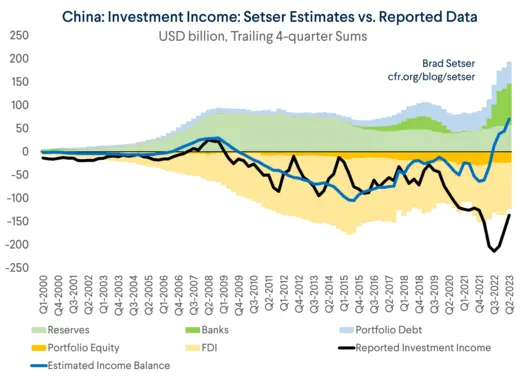
Factoring in all of this, China’s interest receipts should now be about $200 billion higher – per the model – than China now officially reports.

China: Investment Income: Setser Estimates vs. Reported Data


The model implies China's overall income balance should now be back in a surplus of around $70 billion thanks to the rise in U.S. short-term interest rates.
So without the unexplained deficit in investment income and the discrepancy between customs goods and balance of payments goods, and China’s current account surplus would now be around $800 billion, over 4 percent of its GDP.

There are enough questions about the true size that I think the IMF should make this a priority in its surveillance.

The last few IMF Article IV reports have focused on China’s fiscal position. The balance of payments hasn’t been an area of concern, or even a real focus.
The IMF's recent staff paper on China’s government balance sheet shows that the IMF is capable of truly exceptional work.

A comparable analysis of how China’s external balance sheet relates to the current account would be enormously valuable. China’s state has a lot of external assets that are not held by SAFE, and no one (to my knowledge) has definitively mapped all of the external assets and liabilities of China’s government, or estimated the returns that they now provide.

That brings me to my final point.
Why would SAFE want to adjust its methodology for counting the goods surplus, and why would it want to muck up the investment income data?
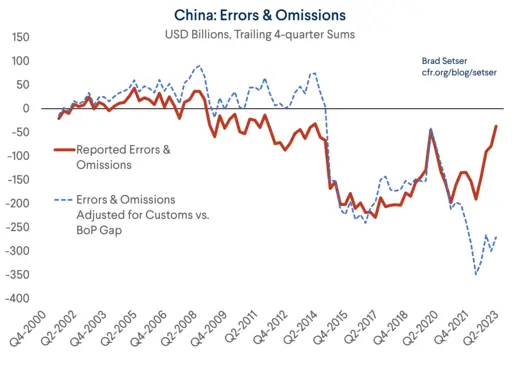
One reason: a lower current account surplus mechanically reduces reported errors and omissions in the data. Errors aren’t directly measured; they are the gap between the calculated current account surplus and the recorded increase in the foreign assets of Chinese residents measured. A lower surplus means lower errors, and thus implies less “hot” outflows.

China: Reported Errors and Omissions Reported and Adjusted


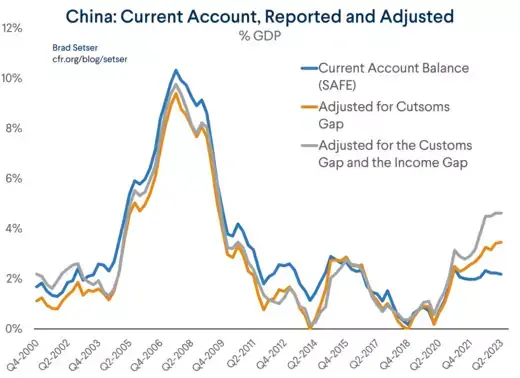
A second reason of course is that a higher current account surplus would lead to more scrutiny from the IMF (the IMF estimates China's current account norm is about a percent of GDP, and allows for a percentage point of GDP error bound, so a 2 percent of GDP surplus doesn't imply any structural undervaluation of the yuan) and from the U.S. Treasury (which has set 3 percent of GDP as its threshold for triggering enhanced scrutiny for currency manipulation).

China: Current Account Reported and Adjusted


Bottom line.
I suspect an accurate measure of China's current account surplus would show two things:
  • China’s current account surplus is 1.5 and 2 percent of GDP higher than reported, and has moved up in line with the increase in China reported customs goods surplus.
  • Errors (disguised capital outflows by Chinese residents) have also remained around 2 percent of China’s GDP rather than collapsing.

Time to try to find out for real.

* The U.S. data shows a smaller deficit than the Chinese data shows a surplus these days, a reversal of the past pattern. The reversal is clearly tied to the tariffs, and the most likely explanation is tariff avoidance (see Anna Wong). Chinese exporters have every incentive to report exports to China customs (to claim the VAT rebate) and most have an incentive to avoid registering in U.S. customs and paying now significant tariffs. Plus, the U.S., as a matter of policy (the de minimis exception), doesn’t collect tariffs on firms like Shein that ship directly to the consumer from China. A U.S. firm can also set up a warehouse in Mexico and ship to American consumers tariff free. Basically, it is easy to show a fall in the bilateral trade deficit if you don’t count a big chunk of imports.

https://www.cfr.org/blog/chinas-current-account-surplus-likely-much-bigger-reported
 

China almost certainly owns more gold than the US – here’s why that matters

China almost certainly owns a lot more gold than anyone else – including the USA. But how much? And why does it need so much gold? Dominic Frisby explains.
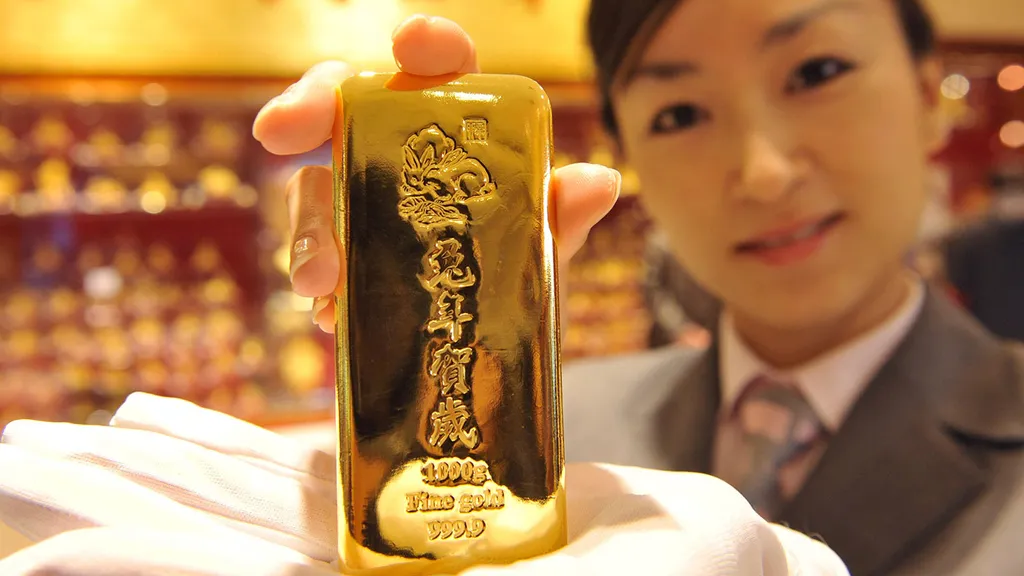
4zkeNZ6FXSyVWAmVqLskzc-1024-80.jpg.webp


If you thought the West was unprepared for
inflation – or indeed for Russia – wait and see just how unprepared it is for this bombshell.

This is the biggest story in world finance, and yet nobody, bar your intrepid blogger, is reporting on it.

For those without the attention spans to read all the way to the end, let’s cut to the chase and get the main point out upfront: China has more gold than the United States.

We’ve seen many examples over the last few decades of how the United States weaponises the dollar, exploiting its status as global reserve currency.

The sanctions on
Russia and its removal from the Swift messaging system this week are perhaps the most dramatic example of all. Russian civilians have had their wealth decimated (in fact, probably significantly more than decimated for most) almost overnight.


China will be surely watching all of this, learning from Russia’s mistakes and thinking it needs to de-dollarise as swiftly and discreetly as possible. Whether to protect its citizens’ wealth or its national interests, China cannot be beholden to a banking system that is run by the West – the US especially – and which is one of their weapons of war.

Both Russia and China have known they must de-dollarise for some considerable time, which is why both have been so steadily increasing their gold holdings.

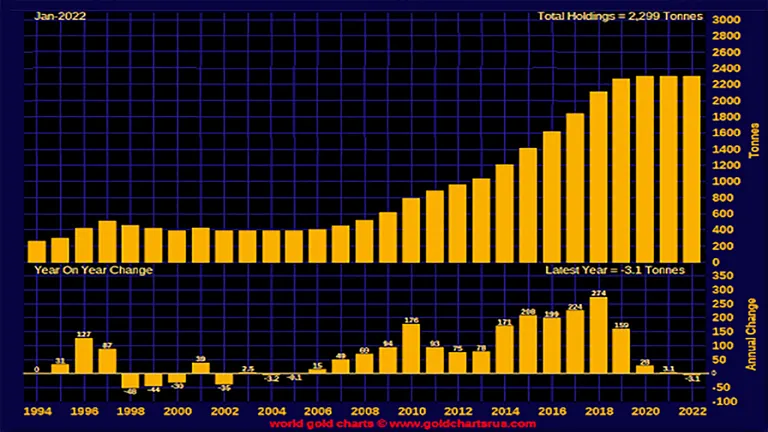
Let’s start with Russia’s gold. The chart is courtesy of Nick Laird of goldchartsrus.com and it shows the Russian Central Bank’s accumulation to today’s figure of, give or take, 2,300 tonnes – roughly 74 million ounces (there are 32,150 troy ounces in a tonne).

z7L3SgAaiywDsZsdTt9iBo-768-80.png.webp


That makes Russia, according to official figures at least, the fifth-largest gold owner in the world.

The table below, courtesy of the World Gold Council, shows the top 19 owners of gold, also their foreign exchange reserves and their percentage allocation to gold. The US has the most – 8,134 tonnes – followed by Germany, Italy, France and Russia.

The UK sits proudly in 17th position. Behind Kazakhstan, Turkey and Uzbekistan. Thank you Gordon Brown.

Row 0 - Cell 0CountryFX reserves $mTotal reserves $mGold holdings %Gold reserves Oz (m)Gold reserves (tonnes)
1USA239,485695,22565.55455,7418,133.5
2Germany99,513287,73265.41188,2193,359.1
3Italy83,583220,96662.17137,3832,451.8
4France102,439238,95457.13136,5152,436.4
5Russian485,462614,25520.97128,7932,298.5
6China3,264,0643,373,2333.24109,1691,948.3
7Switzerland1,019,1651,077,4395.4158,2741,040.0
8Japan1,358,1411,405,5433.3747,402845.9
9India598,057639,7366.5241,679743.8
10Netherlands28,22962,54754.8734,318612.4
11Taiwan544,899568,6364.1723,7367423.6
12Kazakhstan13,40735,66462.4122,257397.2
13Turkey81,176103,18621.3322,010392.8
14Uzbekistan13,07034,55862.1821,489383.5
15Portugal11,60633,04264.8821,436382.6
16Saudi Arabia465,059483,1613.7518,102323.07
17UK175,879193,265917,386310.3
18Lebanon19,43035,50145.2716,072286.8
19Spain75,47991,25617.2915,778281.6
The country we are focusing on today is the one in sixth place on that table, China.


HERE’S WHY CHINA’S GOLD RESERVES MUST BE FAR BIGGER THAN OFFICIAL DATA SUGGESTS

First, consider China’s US dollar holdings – over three trillion of them. That’s more than the UK’s annual GDP. Its US dollar holdings eclipse those of every other nation; China is not going to want those to go to zero – not yet, anyway.

Then consider its gold holdings. It has 1,948 tonnes, barely 3% of its foreign exchange reserves. The US’s gold holdings equate to over 65% of its reserves.

What if China were to approach that level?

Well, my argument is that China has much more gold than it says it does.

There are two parts to this argument. First, China’s gold mining. In 2007, China overtook South Africa as the world’s largest gold producer. It has remained so ever since. This past decade it has produced about 15% of all the gold mined in the world.

Since 2000, China has mined roughly 6,830 tonnes. Over half of Chinese gold production is state-owned – the China National Gold Group Corporation alone accounts for 20%. And China keeps the gold it mines – the export of domestic mine production is not allowed.

I say that number again: 6,830 tonnes. Already that official 1,948 figure looks very dubious.

With reserves in decline at home, Chinese mining companies have also been buying assets abroad, across Africa, South America and Asia. International production exceeds domestic production – by about 15 tonnes in 2020.

Second, there is the fact that, as well as being the biggest producer, China is the world’s biggest importer. Gold imports via Switzerland and Dubai are not always declared, but we do know that via Hong Kong alone, over 6,700 tonnes have entered the country since 2000.

Add that to cumulative gold production since 2000, and you get a figure over 13,500 tonnes.

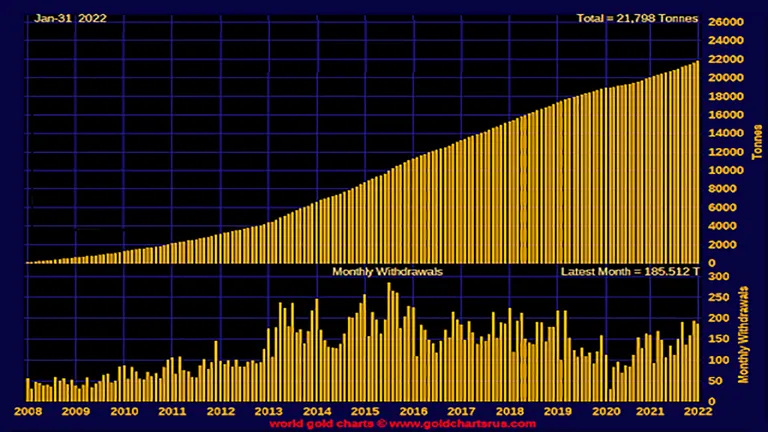
Whether imported, mined or recycled, most of the gold that enters China goes through the Shanghai Gold Exchange (SGE), including the gold imported from Hong Kong. So SGE withdrawals – for which we do have numbers – can act as something of an approximation for demand. And it is possible to get numbers for SGE withdrawals: since 2008, almost 22,000 tonnes have been withdrawn from the SGE.

SLxe6MzdYv83sHn8U6AvXH-768-80.png.webp
Then we have to add gold held in China, whether as bullion or jewellery, before 2000. The World Gold Council estimates a figure of 2,500 tonnes in privately-held jewellery. Added to domestic mining and official reserves, you get a figure of around 4,000 tonnes.

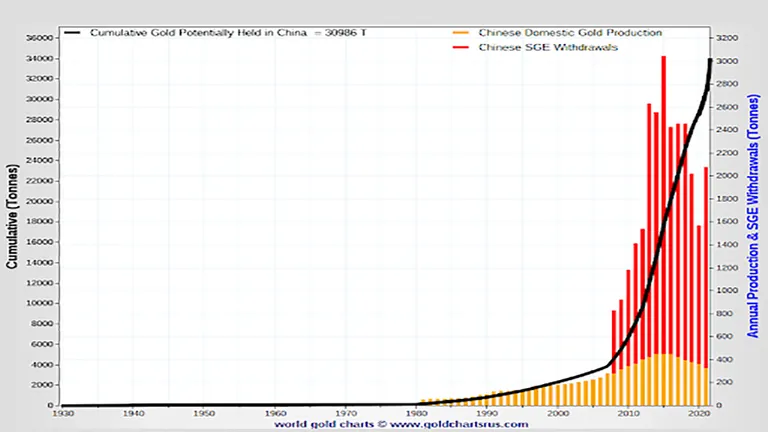
Cobble it all together – cumulative production, imports and existing stock – and you arrive at a figure not far off 31,000 tonnes.


nUmFaKa9mnVkmj5pm9Rmha-768-80.png.webp


I’ve spoken to some of the world’s top analysts – Ross Norman, Bron Suchecki and Koos Jansen – and they all arrive at similar estimates. Alasdair McLeod of Goldmoney thinks it is higher still.

SO WHY WOULD CHINA KEEP ITS GOLD RESERVES QUIET?

But there is more, as Ross Norman points out.

Not all gold entering China is accounted for by SGE withdrawals. The People's Bank of China (PBOC), the central bank, likes to buy 12.5kg bars, which do not trade on the SGE. The PBOC often uses dollars on exchanges in London, Dubai and Switzerland, while the SGE sells its gold in yuan.

The Chinese army, too, owns gold and does not have to declare its purchases. And there are other state agencies, as well: the State Administration of Foreign Exchange and China Investment Corporation – the sovereign wealth fund, for example.

How much of this gold is state owned? Norman guesses 50%; Suchecki, formerly of the Perth Mint, says 55%.

At 50%, the implication is that China owns over 15,000 tonnes – closing in on double the US.

“Chinese Central Bank gold holdings have apparently been entirely unchanged since mid-2019 at 1,948 tonnes,” Ross Norman tells me. “But few of us believe that. Put an additional zero on the end (19,480 tonnes) and I should not be surprised if that is not much closer to their official holdings”.

Alasdair McLeod goes one stage further. “The PRC probably has as much as 30,000 tonnes hidden in various accounts, but not declared as official reserves”.

Whether ten, 15 or 30,000 tonnes, there is no way China can declare such large holdings. Not yet anyway – it would cause an unwanted surge in both the yuan and the gold price. The government's $3.2trn of US dollar foreign exchange reserves would be devalued.

“I don’t think China needs to brag about its largesse,” says Norman. “After all, a stronger currency as a result of that reserve backing would be counter-productive, as it would confer competitive disadvantage”.

What’s more, to declare so much gold would be a direct challenge to American supremacy, which China is probably not yet ready for. Parity first, then supremacy.

For now they follow Deng Xiaoping's doctrine of “we must not shine too brightly.” Its declared 1,948 tonnes is, perhaps, the bare minimum it could declare and look credible. But a mere 3% of China’s forex reserves in gold? Pull the other one.

If China decides to weaponise money, as the US has done, all it has to do is declare its gold holdings, perhaps even partially back the yuan with them. Talk was, at one stage, its
central bank digital currency (CBDC) would be partially gold backed.

Unbacked Western money risks losing a great deal of its purchasing power in such an event. To back Western fiat even partially with gold would mean a dramatic upwards revaluation of gold – into the tens of thousands.

But that is the card China now has with its 20 years of relentless accumulation. He who owns the gold, makes the rules.
 
No matter whatever the real state of Chinese economy and finance, the US is not happy in anyway.
 
Chinese coping hard now that Chinas ability to surpass US GDP is fading quickly.

It will stick take another 10-15 years for the world to accept that the narrative of the 2010s, “Chinas inevitable rise”, has been thoroughly crushed.
 
  • Haha
Reactions: ety
Chinese coping hard now that Chinas ability to surpass US GDP is fading quickly.

It will stick take another 10-15 years for the world to accept that the narrative of the 2010s, “Chinas inevitable rise”, has been thoroughly crushed.
It's your media claiming China is lowballing the size of its economy, where the hell did you get the idea that China is coping?
 
Last edited:
It's US that is coping , trying to fake it as the top economy buy recklessly printing money and pushing up the inflation, making the general populous poorer and poorer and the government can't afford any meaningful infrastructure upgrading.

32925.jpeg

25409.jpeg
 
Chinese coping hard now that Chinas ability to surpass US GDP is fading quickly.

It will stick take another 10-15 years for the world to accept that the narrative of the 2010s, “Chinas inevitable rise”, has been thoroughly crushed.
And we forget to tell you, Huawei is dead, lol....
 
China’s PPP GDP is only 25% larger than that of the US? Come on people… who are we kidding? Last year, China generated twice as much electricity as the US, produced 12.6 times as much steel and 22 times as much cement. China’s shipyards accounted for over 50% of the world’s output while US production was negligible. In 2023, China produced 30.2 million vehicles, almost three times more than the 10.6 million made in the US.

On the demand side, 26 million vehicles were sold in China last year, 68% more than the 15.5 million sold in the US. Chinese consumers bought 434 million smartphones, three times the 144 million sold in the US. As a country, China consumes twice as much meat and eight times as much seafood as the US. Chinese shoppers spent twice as much on luxury goods as American shoppers.
China's true GDP must be at least a third bigger than that of US. China likes to keep a low profile and holds on to the much rewarding "developing country" status.
 
And China always massively underestimates herself, in 2002, Chinese government news paper predicted that China might be able to overtake Japan in GDP in 2050.
The fact is China did it in 2010, forty years before the government prediction.

20231231101236731.png
 
And China always massively underestimates herself, in 2002, Chinese government news paper predicted that China might be able to overtake Japan in GDP in 2050.
The fact is China did it in 2010, forty years before the government prediction.

View attachment 62385
What kind prediction was that, by some US and Japan worshipping economists ? The GDP growth rate of China in 2002 was 9.1% and Japan 0.0%.
 
China's true GDP must be at least a third bigger than that of US. China likes to keep a low profile and holds on to the much rewarding "developing country" status.

:rolleyes: You actually mean lie to the IMF, World Bank, UN, OECD, the WTO and all the other world organizations China submits numbers to which keeps track of these things.

It has been stated for decades not to trust any official numbers the Chinese Government posts for any topic...no matter how hard the CCP claims it is being truthful.
 
Last edited:

Users who are viewing this thread

Back
Top