Beijingwalker
VIP Member

Number of people living in extreme poverty2025
Extreme poverty is defined as living below the International Poverty Line of $3 per day. This data is adjusted for inflation anddifferences in living costs between countries.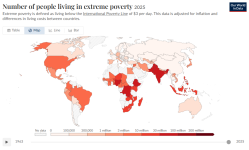
Data source: World Bank Poverty and Inequality Platform (2026) – Learn more about this data
Note: This data is expressed in international-$ at 2021 prices. Depending on the country and year, it relates to income (measured after taxes and benefits) or to consumption,per capita. Where data for 2025 is unavailable, the value from the closest year between 2020 and 2026 is shown instead.
What you should know about this indicator
- The World Bank defines extreme poverty as living on less than $3 per day. This threshold, known as the “International Poverty Line”, is set so that poverty can be compared across countries. This indicator plays an important and successful role in focusing the world’s attention on the very poorest people. The UN uses this indicator to track progress toward ending extreme poverty by 2030.
- Two centuries ago, most of the world’s population was extremely poor. Many believed that widespread poverty was inevitable. But this turned out to be wrong. Economic growth is possible, and poverty can decline. With this poverty line, we can track whether countries are leaving the worst poverty behind.
- This data comes from the World Bank’s Poverty and Inequality Platform, which is based on a large collection of national survey data. To achieve wide coverage, it pools data from two kinds of surveys. For high-income countries, the data measures people’s incomes after taxes and benefits. For most low- and middle-income countries, it instead measures their consumption — a different but closely related measure.
- In lower-income countries, many people produce food for their own use or exchange goods without money. This data accounts for that by estimating what these goods would have cost if bought in the market and adding that value to their consumption.
- The exact surveys that countries run can change over time, creating breaks across which data points are less comparable. The World Bank provides an indicator of where these breaks occur, and this chart gives the option to show the breaks.
- For a small number of countries and years, the data source provides two estimates: one measuring households' income and one measuring consumption. To show a single series over time, we keep only one of these observations. You can see which measure each data point corresponds to by selecting the option to show breaks in the data.
- Regional and global estimates are extrapolated to the year of the data release using growth estimates and forecasts from national accounts. For more details about the methodology, please refer to the World Bank PIP documentation.
- This data is expressed in constant international dollars to adjust for inflation and differences in living costs between countries. Read more in our article, What are international dollars?