You are using an out of date browser. It may not display this or other websites correctly.
You should upgrade or use an alternative browser.
You should upgrade or use an alternative browser.
SARS-CoV-2/COVID related discussion
- Thread starter Yommie
- Start date
Yommie
Elite Member
- Oct 2, 2013
- 56,567
- 36,794
- Country of Origin

- Country of Residence

- Thread starter
- #1,236
Log in to Facebook
Log in to Facebook to start sharing and connecting with your friends, family and people you know.
 www.facebook.com
Janet Hanlin
Admin
· ·
Weekly Ontario Update for Friday, June 28, 2024:
Public Health Ontario has further reduced the amount of data available to the public. Unless indicated otherwise, information in this update includes data from Sunday, June16 to Saturday, June 22, so data is delayed.Data relating to deaths is even further delayed as cause of death is taking MONTHS to be determined. So recent deaths will end up being far WORSE in the future than are being reported for today.
- Recent cases: not reported (unknown compared to last week)
 This number is no longer being reported!
- Weekly positivity rate: 9.0% (- 0.1% since last week)
- Recent deaths: 2 (- 1)
Recent deaths are a lagging indicator of the current level of new cases. Deaths are underreported because they are based on date of death and by the time the cause of death is reported, it is no longer considered recent! - Average daily hospital bed occupancy: 299* (+ 5 since last week week)
*Please interpret the COVID-19 hospitalization data with caution as not all centers are reporting..
Yommie
Elite Member
- Oct 2, 2013
- 56,567
- 36,794
- Country of Origin
- Country of Residence
- Thread starter
- #1,240

Covid Situation Report: Jul 5, 2024
Update on Covid providing information on prevalence and hospital admissions for England and its regions. This post is best viewed using the browser or Substack app.
 bhawkins3.substack.com
Covid Situation Report: Jul 5, 2024
Update on Covid providing information on prevalence and hospital admissions for England and its regions. This post is best viewed using the browser or Substack app.

BOB HAWKINS
JUL 05, 2024
17
5
Share
Introduction.
This report is part of a weekly series that summarises the Covid situation in England and its regions.A reminder that not all of the data previously included in the situation update is now available on a weekly basis. Where relevant, changes to the content and data sources have been noted.Please be aware that this week's report has been delayed by a day due to the election 'embargo,' which postponed the publication of the data.
This week's report contains data on weekly Covid hospital admissions from the UKHSA surveillance report, which is now released biweekly. Additionally, it includes case rates from the UKHSA Covid dashboard. The report also provides the latest vaccination status as the Spring 2024 booster campaign comes to an end.
Summary.
This week's data indicates that the recent rise in Covid levels has reached a peak, with positivity rates, hospital admissions and case rates now stabilising. These figures are higher than those recorded during the May wave but remain significantly lower than the peaks seen in the winter of 2023.In the past two weeks, the positivity rate for Covid increased significantly but is now showing early signs of falling. Positivity rates are highest in the older age groups.
Hospital admission rates for Covid have risen significantly in the past two weeks, though they have now stabilised at levels higher than those observed in May, yet still considerably lower than the peak seen in winter 2023.
The recent increase in daily case rates across all regions has plateaued and is starting to fall in several region, especially in the North East, which experienced the most substantial increase.
Although this wave is most likely over, this is an important reminder that Covid is not yet a seasonal disease, and we are likely to experience further waves as new variants emerge and immunity levels wane.
The Spring 2024 booster campaign in England closed on June 30. At the end of the campaign, just under than 4.3 million doses have been administered, covering an estimated 60% of the eligible population. However, immunosuppressed individuals continue to have lower vaccine coverage.
As always, it’s important to remember that the risk of hospitalisation from Covid infection increases significantly with age and for those immunocompromised. Also Long Covid remains a risk for all as shown by the recent ONS report. Therefore, it is prudent to take appropriate measures such as self-isolating when experiencing Covid symptoms and enhancing ventilation or wearing masks whenever possible.
For those who are interested, I recently published an article covering the ONS data on Long Covid in more detail which can be found here. Also a comprehensive review of the evidence in support of wearing masks is available here.
Status of main respiratory diseases in England.
This section presents the latest available data on positivity rates for primary respiratory infections in England. It is important to understand that positivity differs from prevalence, which refers to the overall percentage of COVID-19 in the general population. Appendix 1 provides a more detailed explanation of the difference and why positivity rates are a useful indicator of trends in Covid infection levelsThe chart below displays the test positivity rates for the main respiratory illnesses in England, including Flu, Covid, RSV, and Rhinovirus.
Over the past two weeks, the Covid positivity rate has increased significantly and reached its highest level for over a year at 12.3% for week ending Jun 23 signalling a resurgence of Covid levels in the general population. The high level has decreased slightly in the most recent week to 11.5%, indicating that the peak of this summer wave has likely been reached. However, this is an important reminder that Covid is not yet a seasonal illness and we are likely to experience further waves as new variants emerge and immunity levels wane.
Meanwhile, the flu positivity rate has continued to fall and remains significantly lower than that of Covid. Additionally, RSV rates have dropped to very low levels, accompanied by a minor decrease in Rhinovirus rates.
The next chart shows the trend for Covid positivity rate by age. Hover your cursor over one of the chart lines to display the positivity rate for all ages. For comparison the grey line shows the positivity rate for all age groups.
The chart clearly indicates that test positivity rates are highest among individuals aged 65 and older. However, it is important to note that the majority of tests are now conducted on hospital patients, who are disproportionately older since they are more likely to be hospitalised due to Covid.
The final chart in this section shows weekly hospital admissions per 100,000 people in England for the main respiratory diseases.
Consistent with the test positivity rate data, the past two weeks have seen weekly hospital admission rates for Covid increased significantly, although they have not reached the levels seen during the winter wave of infections. Once again, the most recent weeks admission rates indicate that this summer wave has likely peaked. Note that hospital admission data for Flu and RSV is no longer published.
Although age-specific data for hospital admissions are no longer released, earlier statistics on Covid hospital admissions and the current test positivity rates by age indicate that the rise in hospitalizations will primarily impact the over 65 year olds.
It's important to note that while testing policies have been updated from April 1, 2024, the guidelines for testing patients showing Covid symptoms or when a positive result would change the patient's treatment remained unchanged. Consequently, the number of Covid hospital admissions should be a dependable indicator of the virus's prevalence in the community for the period shown in these charts.
Covid hospital admissions and bed occupancy.
This section gives a more detailed examination of the most recent daily Covid data for hospitals in England.NHS England stopped the weekly publication of data used to create these dashboards from April 4, 2024 and have moved to a monthly publication schedule. The next update will be on July 11, 2024 covering June Covid hospital admissions and bed occupancy.
Covid case rates
The UKHSA Covid dashboard continues to publish daily case rates on a weekly basis. As the majority of testing now occurs in hospitals or under medical supervision, these rates are closely aligned with hospital admissions and the positivity rate of tests.The first chart in this section compares the daily case rate per 100,000 individuals, shown in red, with prevalence reported from the Winter Infection Survey, depicted in blue. As prevalence is considered the ‘gold-standard’ measure of Covid levels in the general population this provides a good indication of how well case rates measure Covid levels.
The chart indicates that the rise in Covid case rates has persisted and stabilised at levels exceeding the May peak. Nonetheless, these rates remain significantly lower than those observed during the peak of the winter 2023 wave.
The next panel chart in this section shows Covid rates for the regions of England. Hover your cursor over one of the chart lines to display the admission rates for all regions.
The panel charts show that the recent surge in case rates across all regions has halted, and in some areas has begun to decline. The North East region, which saw the sharpest increase, is now seeing the most rapid fall.
Spring 2024 booster campaign
The Spring 2024 booster campaign started on April 15 and closed at the end of June. Considering the decline in vaccine efficacy after 15 weeks, a successful Spring 2024 booster campaign is important to protect the most vulnerable populations.The following chart displays the weekly number of doses administered during the booster campaigns for England to date. The Spring campaigns are represented in green, the Autumn campaigns in brown, and doses administered outside of these campaigns are depicted in grey.
The Spring booster campaigns are exclusively for individuals aged 75 and above, residents of care homes, and those with compromised immune systems. According to NHS England, approximately 7.3 million people qualify for the Spring campaign in England.
The Spring 2024 booster campaign in England closed at the end of June, with 121,394 doses administered in the final week, giving a total 4,288,462 doses given over the course of the campaign. This represents 59% of the estimated eligible population; however, it is likely that the recorded number of doses will be updated in the coming weeks as the database is refreshed.
The following chart illustrates the weekly coverage for the three eligible cohorts in England since the start of the campaign.
The data shows reasonable levels of coverage for those in care homes and individuals 75 years and older. However, individuals with compromised immune systems continue to have lower vaccine coverage.
In conclusion
Despite the reduced level of data now published, the available information indicates that the recent increase in Covid levels has most likely come to an end and we should expect to see levels falling next week.The Spring 2024 booster campaign has now closed, with just under 4.3 million doses administered. However, the immunosuppressed remain under vaccinated.
As always, if you have any comments on this Covid Situation Report or suggestions for topics to cover, please post a message below.
Subscribe
Appendix 1. Test positivity rates and prevalence
Positivity rates are derived from the results of hospital laboratory tests conducted on patients exhibiting symptoms of respiratory diseases. Test positivity is the percentage of patients who test positive for Covid of the total number of patients tested. Since the individuals tested for this measure are not a representative sample of the general population it differs from prevalence, which is derived from a representative sample of the population.Test positivity rates, while not directly estimating the number of Covid infections in the general population, can be a valuable indicator of the infection trend. The panel chart below compares the weekly test positivity rate among hospital patients with respiratory symptoms to the prevalence of Covid in the general population, as reported in the Winter Infection Survey.
The chart shows that the weekly test positivity rates for patients with symptoms of respiratory infections follows the same pattern as the prevalence for Covid reported by the Winter Infection Survey. Since the Winter Infection Survey is based on a representative sample of the general population this supports using test positivity as a useful proxy for infection trends.
Yommie
Elite Member
- Oct 2, 2013
- 56,567
- 36,794
- Country of Origin
- Country of Residence
- Thread starter
- #1,241
Is the current Covid wave in England peaking?
Yes - probably. Plus looking ahead to the future.
Is the current Covid wave in England peaking?
Yes - probably. Plus looking ahead to the future.

CHRISTINA PAGEL
JUL 05, 2024
55
11
Share
England is short on Covid data. This is extremely irritating, especially when we are in the middle of a significant Covid wave. It means we can’t say anything for sure but are forced to search for clues in the sparse and imperfect data that remains. This week, that comes down to UKHSA data on hospital admissions in England with Covid, Scottish wastewater data and Covid variant sequencing on very few samples.
Hospital admissions
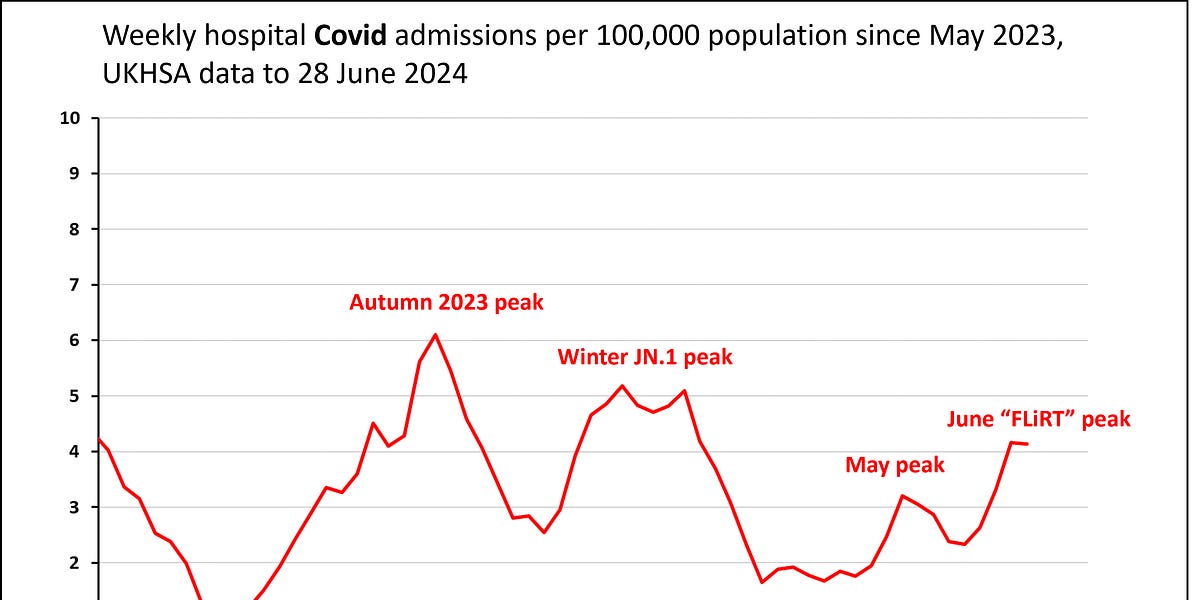
The latest data shows that the most recent week to 28 June was flat - which hopefully signifies that we are at, or have just passed, the peak.This wave has been substantially bigger than May’s one but so far - in terms of admissions - lower than the peaks at the end of 2023. While hospitals are testing far less than they used to, hospital testing practices should have been stable over the last year, making the waves in admissions comparable.
My prediction from early June held up well I think, where I said to expect a June wave that would be bigger (in terms of hospital admissions) than May’s but lower than December’s.
Subscribe
Variants
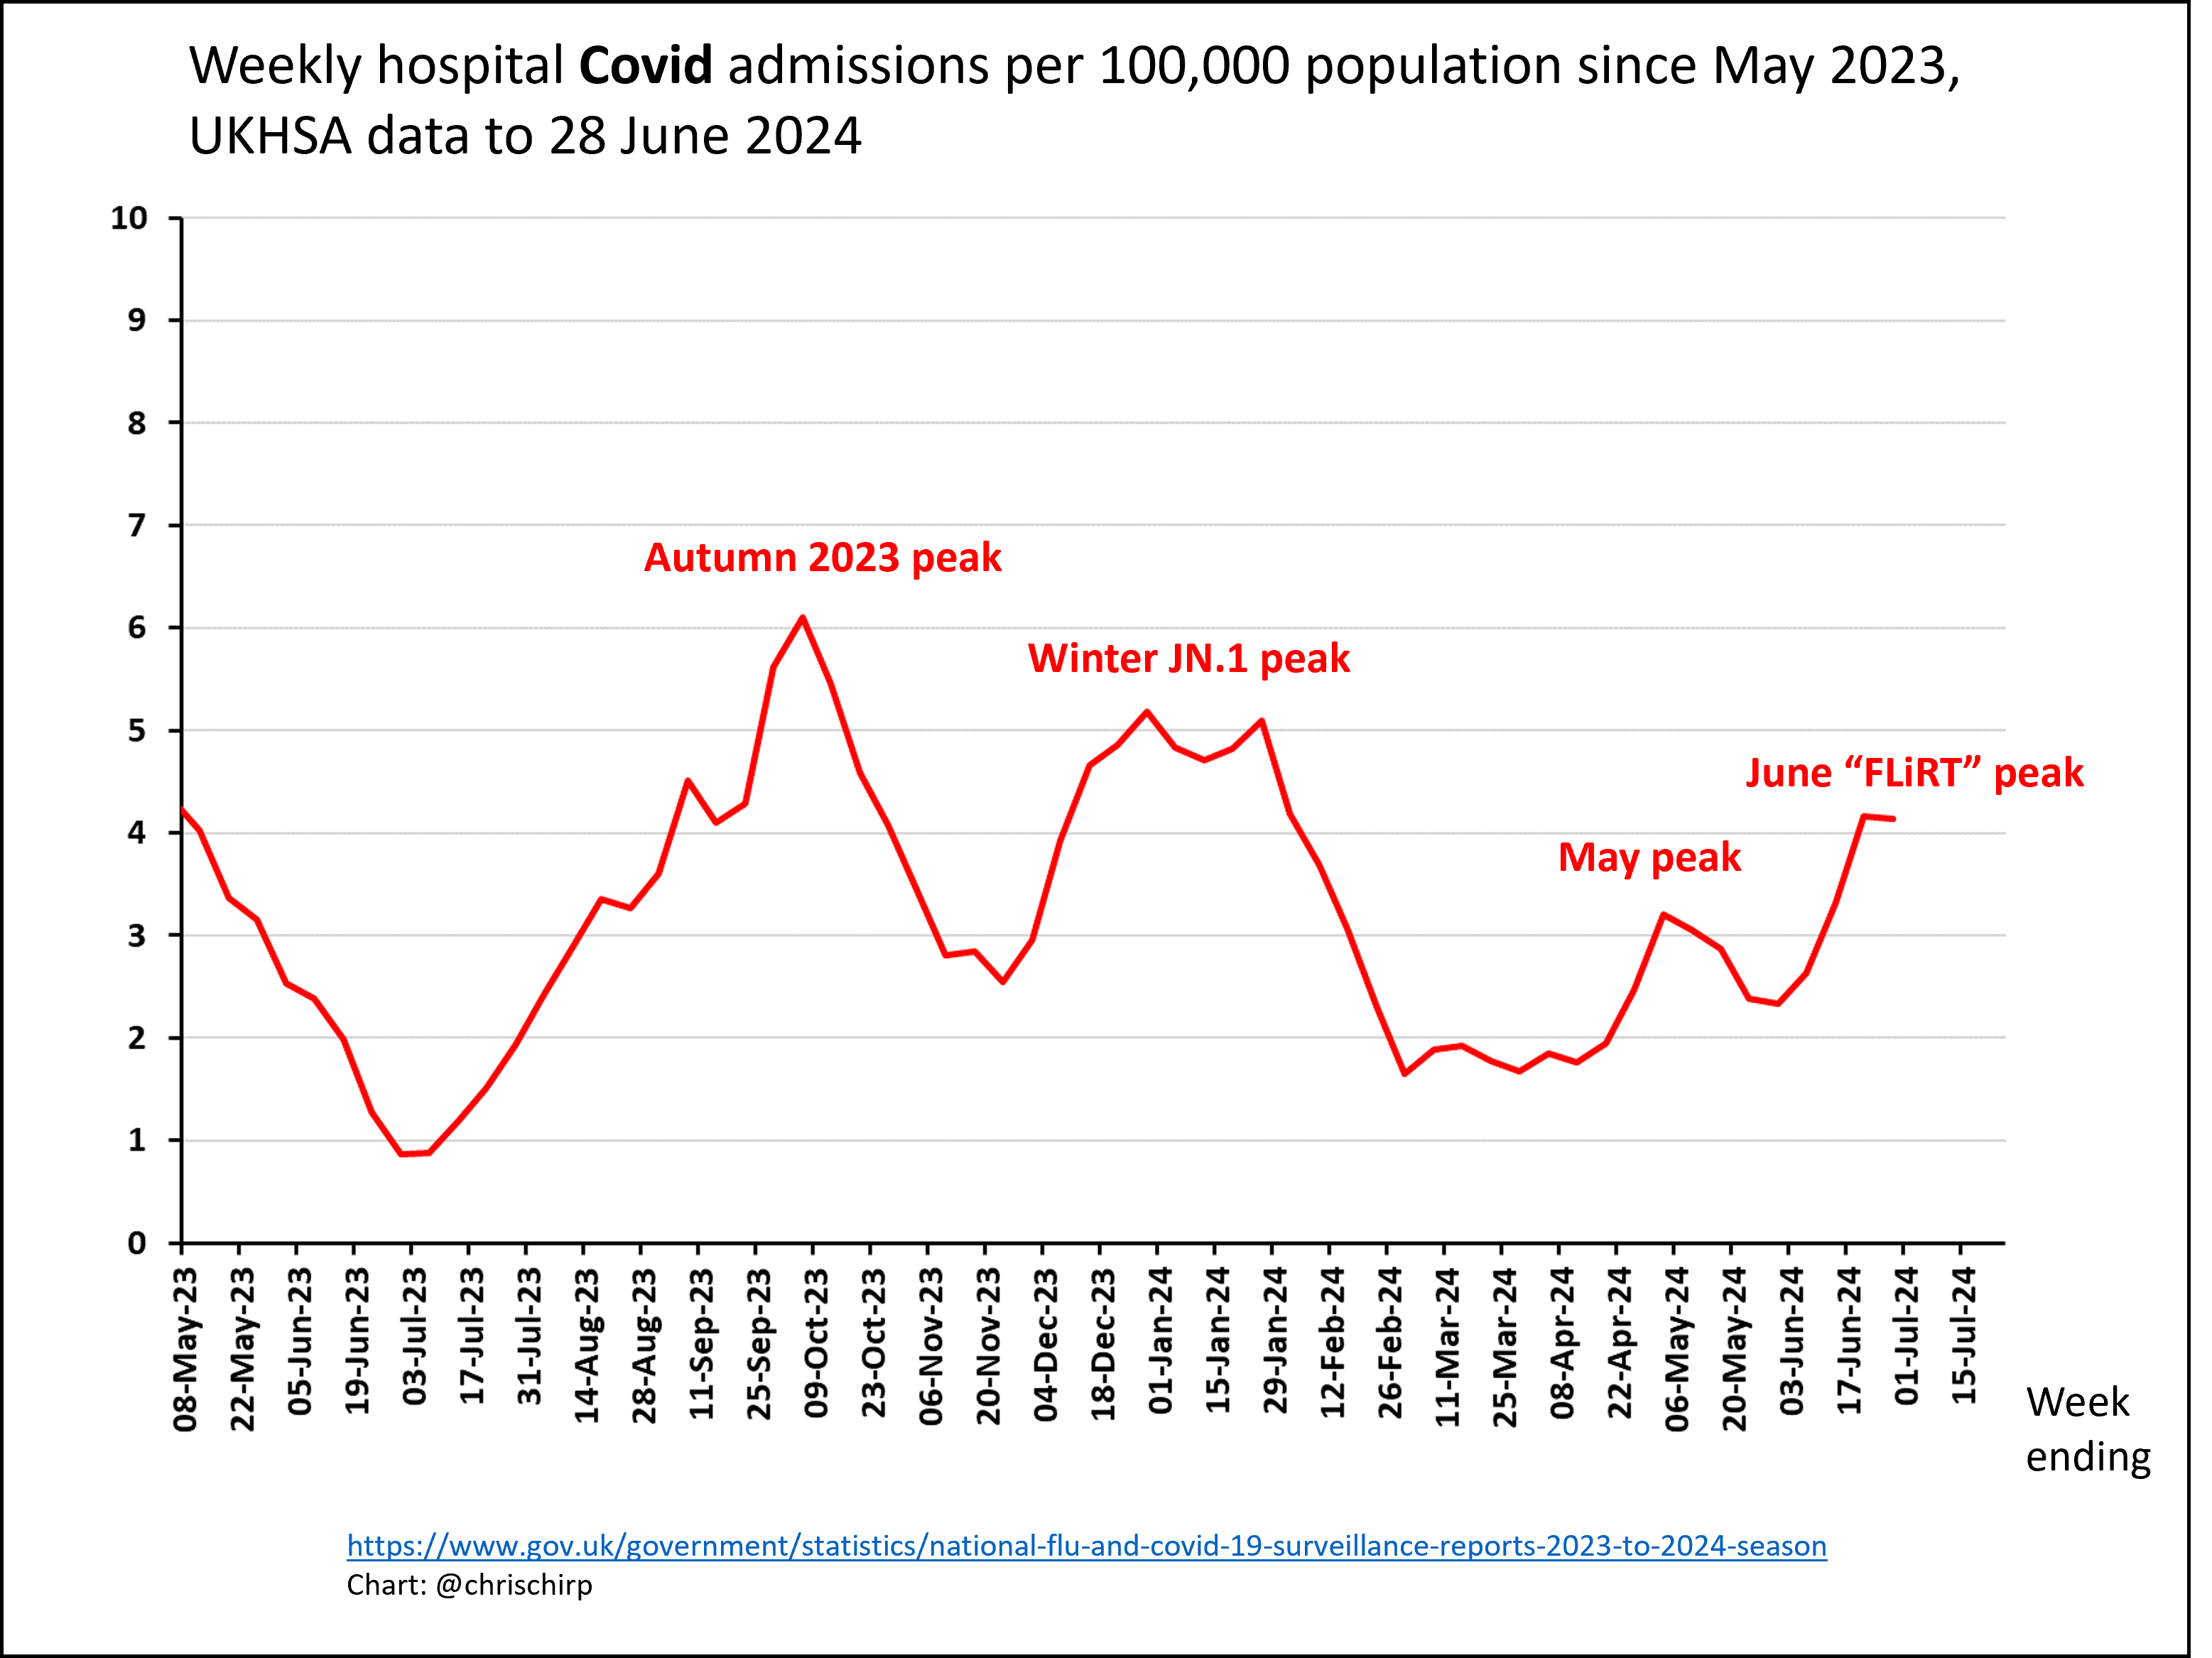
We are not sequencing very much at all now (just positive PCR tests from hospital patients really, which represent mainly older people). That said, the data suggests that the “FLiRT” variant KP.3 is dominant in England and has been for a week or two.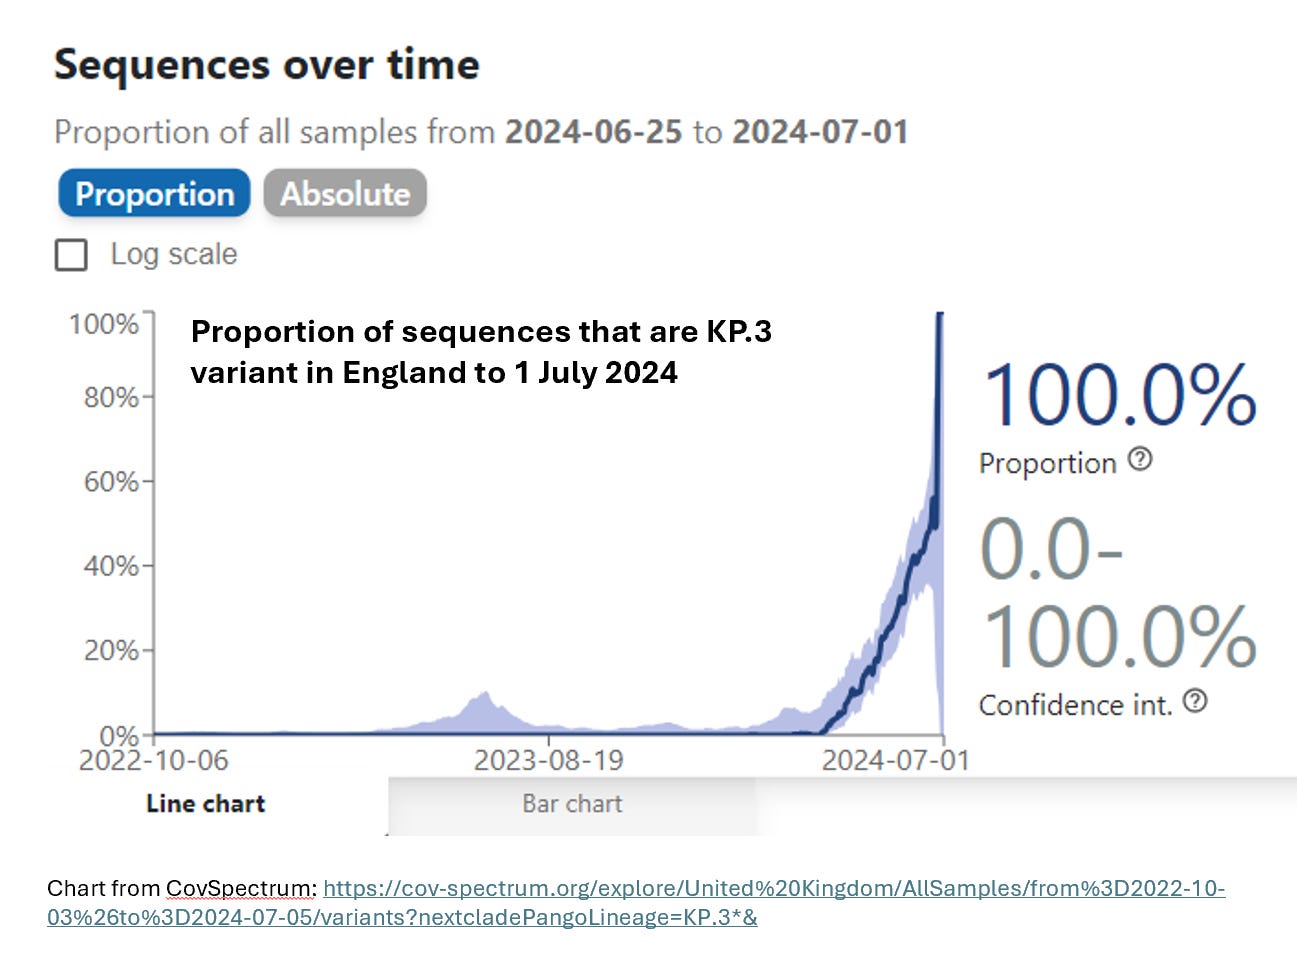
KP.3 is very able to evade existing antibodies to infect people and has been causing large waves all around the world. However, there is no indication it is more severe.
Share
Wastewater
Scotland is still monitoring wastewater for Coronavirus - and fhe hundredth time, England should be too (and for H5N1 (Bird Flu) too!). Its most recent data up to 26 June shows sharp increases and no sign yet of peaking.
Virus levels in wastewater are not directly related to number of people infected - a lot depends on viral loads (how much virus an infected person sheds, which varies a lot person to person and infection to infection) and how much of the virus is in your gut (and so gets excreted out). But certainly, it looks as if this is a significant wave with a significant minority of the population infected. We would need the return of the ONS Infection Survey to be sure, and sadly we don’t have that any more.
England normally sees new variants a few days before Scotland (because of travel and population patterns), so I suspect that England’s wave is just peaking (or has just finished), especialy because KP.3 has probably been dominant a couple of weeks already. But because of the Scottish wastewater I am not certain, especially as there will be plenty of mixing happening to watch the football.
Summary
England is in the middle of a large Covid wave, hopefully just starting the downward slope. Hospital admissions are lower than they were during 2023 peaks, and fortunately this wave came not long after the Spring booster campaign which will have protected many in our most vulnerable populations. For an update on the Spring booster campaign please see this substack from Bob Hawkins.Although it’s good that hospital admissions are nowhere near what they were at the pandemic’s height, waves of infection are never good news. Many people will be off work while sick and some (perhaps 1-2% of infected people) will go on to develop new Long Covid. The percentage developing new Long Covid has come down because of vaccination and previous infection, but it is not zero and there are still few effective ways to treat Long Covid.
It is also self evident that Covid is in no way a winter respiratory bug - its behaviour is nothing like flu or RSV, the other main respiratory viruses that can cause severe illness and do every winter. While flu and RSV are pretty much confined to November to March, Covid waves can and do happen at any time of year. We are still in three to four waves a year, each causing some disruption to people’s lives, employment and the NHS.
Subscribe
Looking ahead
Today sees a new Labour government in the UK. While the incoming government has a massive challenge on its hands across all policy fronts, I hope that this will represent an opportunity for a reset in how we think about Covid and airborne diseases more broadly (particularly with the threat of bird flu (H5N1) ever present).Committing to cleaner indoor air would be an important public health step, with many benefits in reducing circulating viruses but also environmental irritants, and improving wellbeing and concentration, as laid out in a detailed report from the Royal Academy of Engineering in 2022. Promoting the use of masks in health care settings and public transport during waves could be useful. These measures won’t get rid of Covid waves, but they should help blunt their impact - and help slow down the spread of winter viruses and any new airborne diseases.
Additionally, restarting wastewater monitoring (for all sorts of viruses) would be extremely helpful for giving us early warning of issues and tracking levels of different infectious diseases in the UK.
We urgently need more research into how to prevent and treat Long Covid. We need better, longer lasting, vaccines that are more variant proof - for instance developing new vaccines based on T-cells as explained here by Prof Sheena Cruickshank.
Finally, the government needs to think about its pandemic plan. It is likely that at some point in the not too distant future, bird flu (H5N1) evolves to be able to spread easily among humans. As Prof Adam Kucharski reminds us, we need to plan for this - what have we learned from Covid that we could use for a flu pandemic? What would need to do differently? How do we prepare support and communications to enable the success of prevention and control measures?
Yommie
Elite Member
- Oct 2, 2013
- 56,567
- 36,794
- Country of Origin
- Country of Residence
- Thread starter
- #1,242

Montreal's EPIC Center testing rehabilitation program for long COVID patients
Drawing on its long experience with patients suffering from cardiac problems, the EPIC Center of the Montreal Heart Institute has developed a personalized cardiovascular rehabilitation program that has allowed certain patients with long COVID to improve their quality of life. After eight weeks...
 montreal.citynews.ca
Montreal’s EPIC Center testing rehabilitation program for long COVID patients

The pool at Montreal's EPIC Center on Sept. 17, 2022. (Pamela Pagano, CityNews)
By The Canadian Press
Posted July 5, 2024 3:06 pm.
Drawing on its long experience with patients suffering from cardiac problems, the EPIC Center of the Montreal Heart Institute has developed a personalized cardiovascular rehabilitation program that has allowed certain patients with long COVID to improve their quality of life.
After eight weeks, some participants in the program were able to improve their cardiorespiratory capacity (the body’s ability to transport and use oxygen) and ventilatory efficiency (the quantity of air necessary to provide an effort).
Some also noted a reduction in the impact of long COVID symptoms on their daily life.
“We have had experience for decades with cardiovascular rehabilitation, particularly with people who sometimes have severe heart disease, but who are (eligible) for rehabilitation,” said Florent Besnier, the postdoctoral researcher leading the study.
“And in people who have this long COVID, there are symptoms that remind us of our patients that we are used to seeing, so muscle wasting, fatigue, problems making efforts in their day-to-day lives… We thought maybe we could help them.”
Besnier adds patients suffering from heart problems and those with long COVID have in common that they become excessively sedentary and physically inactive, which contributes to their deconditioning.
Intrigued by these similarities between the two patient populations, Besnier and his colleagues recruited and randomly divided into two groups 40 participants with an average age of 53 years.
The first group followed an individualized clinical rehabilitation program at the EPIC Center for eight weeks. The program included three weekly sessions of aerobic and resistance exercises as well as daily inspiratory muscle training. The second group maintained their daily habits, without additional intervention for the same period.
“In the interventional group, we could observe a significant improvement, statistically and clinically, in cardiorespiratory capacity of approximately 13 per cent,” said Besnier. “We also saw a significant improvement in ventilatory efficiency. If I simplify a little, the patients are a little less out of breath for the same level of effort as before the study.”

Doctors excited about targeted prostate cancer therapy, but can’t prescribe it yet
Dale Cousins was thrilled when he saw his body scans from before and after a new prostate cancer treatment. “(The doctor) said, ‘Do you see any difference?'” the 79-year-old from Petrolia, Ont., recalled. “I…
2h ago
Montreal’s EPIC Center testing rehabilitation program for long COVID patients
The researchers also measured a significant improvement in “functional parameters” such as the ability to walk, stand up or sit down. “We are talking about the impact of the symptoms, not their severity. The impact of symptoms on family, personal or professional life had diminished,” said Besnier.
A third of the members of the intervention group did not benefit from any improvement. All these results, whether positive or negative, are comparable to those obtained during an intervention with cardiac patients.
Those responsible for the study remind that it was a small study with only 40 participants. It is therefore not possible to “generalize” the results obtained to all patients with long COVID, said Besnier, even if this represents for them a glimmer of hope by demonstrating that it is probably possible to improve their situation if they are offered the right rehabilitation program.
“We must now evaluate the long-term impact of the rehabilitation program, but I remain optimistic,” said Besnier, who pointed to a study recently published by the medical journal BMJ that showed improvements were still present one year after the intervention.
The findings of this study were published by the American Journal of Physical Medicine and Rehabilitation.
–This report by la Presse Canadienne was translated by CityNews
Yommie
Elite Member
- Oct 2, 2013
- 56,567
- 36,794
- Country of Origin
- Country of Residence
- Thread starter
- #1,243

COVID-19 variant KP.3 remains dominant in US, rises to 36.9% of cases: See latest CDC data
The COVID-19 KP.3 variant continues to dominate in the United States now accounting for 36.9% of positive COVID cases.
 www.usatoday.com
COVID-19 variant KP.3 remains dominant in US, rises to 36.9% of cases: See latest CDC data
The CDC predicts that the KP.3 COVID-19 variant will 'continue increasing.'
 Ahjané Forbes
USA TODAY
The KP.3 COVID-19 variant is continuing to lead as the dominant variant, the newest Centers for Disease Control and Prevention (CDC) data shows.
For a two-week period starting on June 23 and ending on July 6, the CDC’s Nowcast data tracker showed the projections of the COVID-19 variants. The KP.3 variant accounted for 36.9% of positive infections followed by KP.2 at 24.4%.
"Estimates predict that KP.3 is the dominant SARS-CoV-2 variant making up 31.2 to 43% of viruses nationally. KP.3 is projected to continue increasing as proportions of the variants that cause COVID-19," CDC Spokesperson, Rosa Norman, told USA TODAY in a statement. "KP.3 evolved from JN.1, which was the major viral lineage circulating since December 2023."
The data also shows that the new variant LB.1 has fallen back 3% by accounting for 14.5% of cases but was previously at 17.5% of infections. JN.1, the previous ring leader since 2023, only had 1.0% of positive cases which is a 0.6% decrease from the previous two-week period.
On July 2, the CDC said that the COVID-19 infections are growing in 39 states, stable or uncertain in 10 states and declining in zero.
Here’s what you need to know about the KP.3 variant.
What is the KP.3 variant?
Like JN.1 and "FLiRT" variants KP.1.1 and KP.2, KP.3 is a similar strain. Norman said that the KP.3 variant is, “a sublineage of the JN.1 lineage” which comes from the Omicron variant.Symptoms of COVID-19
The CDC has not said if KP.3 has its own specific symptoms. Norman said the symptoms associated with KP.3 are similar to those from JN.1. However, the government agency outlines the basic symptoms of COVID-19 on its website. These symptoms can appear between two to 14 days after exposure to the virus and can range from mild to severe.These are some of the symptoms of COVID-19:
- Fever or chills
- Cough
- Shortness of breath or difficulty breathing
- Fatigue
- Muscle or body aches
- Headache
- Loss of taste or smell
- Sore throat
- Congestion or runny nose
- Nausea or vomiting
- Diarrhea
- Trouble breathing
- Persistent pain or pressure in the chest
- New confusion
- Inability to wake or stay awake
- Pale, gray or blue-colored skin, lips, or nail beds
How can we protect ourselves from KP.3 and other variants?
The CDC recommends for everyone ages 6 months and older, with some exceptions, receive an updated 2024-2025 COVID-19 vaccine to protect against the disease, regardless whether or not you have previously been vaccinated against the virus.CDC data shows the COVID-19 test positivity by state
CDC data shows which states has the lowest and highest COVID-19 positivity rates from June 29 to July 5, 2024.Can't see the map? Click here to view it.
Within the past week COVID-19 test positivity has risen 9%, the CDC data shows.
Changes in COVID-19 test positivity within a week
Based on data collected by the CDC it showed that five states had the biggest increase of 4.7% in positive COVID-19 cases from June 29 to July 5, 2024.Here's the list of states and their changes in COVID-19 positivity for the past week.
| State | Change in COVID-19 test positivity in (%) |
| Alabama | +2.6 |
| Alaska | +3.4 |
| Arizona | +2.1 |
| Arkansas | +4.7 |
| California | +2.1 |
| Colorado | +2.6 |
| Connecticut | +0.7 |
| Delaware | +2.3 |
| District of Columbia | +2.3 |
| Florida | +2.6 |
| Georgia | +2.6 |
| Hawaii | +2.1 |
| Idaho | +3.4 |
| Illinois | +2.9 |
| Indiana | +2.9 |
| Iowa | +2.3 |
| Kansas | +2.3 |
| Kentucky | +2.6 |
| Louisiana | +4.7 |
| Maine | +0.7 |
| Maryland | +2.3 |
| Massachusetts | +0.7 |
| Michigan | +2.9 |
| Minnesota | +2.9 |
| Mississippi | +2.6 |
| Missouri | +2.3 |
| Montana | +2.6 |
| Nebraska | +2.3 |
| Nevada | +2.1 |
| New Hampshire | +0.7 |
| New Jersey | +2.2 |
| New Mexico | +4.7 |
| New York | +2.2 |
| North Carolina | +2.6 |
| North Dakota | +2.6 |
| Ohio | +2.9 |
| Oklahoma | +4.7 |
| Oregon | +3.4 |
| Pennsylvania | +2.3 |
| Puerto Rico | +2.2 |
| Rhode Island | +0.7 |
| South Carolina | +2.6 |
| South Dakota | +1.5 |
| Tennessee | +2.6 |
| Texas | +4.7 |
| Utah | +2.6 |
| Vermont | +0.7 |
| Virginia | +2.3 |
| Washington | +3.4 |
| West Virginia | +2.3 |
| Wisconsin | +2.9 |
| Wyoming | +2.6 |
Ahjané Forbes is a reporter on the National Trending Team at USA TODAY. Ahjané covers breaking news, car recalls, crime, health, lottery and public policy stories. Email her at aforbes@gannett.com. Follow her on Instagram, Threads and X (Twitter) @forbesfineest.
Contributing: Emily DeLetter
Users who are viewing this thread
Total: 2 (members: 0, guests: 2)
Pakistan Defence Latest
Country Watch Latest
-

-

-
 "I Locked Onto A Pakistani F-16 For 30 Seconds": Kargil Hero's Account (17 Viewers)
- Latest: PAKISTANFOREVER
-
 India becomes exporter of sniper rifles, Bengaluru firm bags mega contract from friendly nation (11 Viewers)
- Latest: panzerfaust 3
-
Iranian Special Presidential Elections 2024 (post shaheed Ebrahim Raisi) (6 Viewers)
- Latest: Kyussis