Navigation
Install the app
How to install the app on iOS
Follow along with the video below to see how to install our site as a web app on your home screen.
Note: This feature may not be available in some browsers.
More options
Style variation
You are using an out of date browser. It may not display this or other websites correctly.
You should upgrade or use an alternative browser.
You should upgrade or use an alternative browser.
Chinese Economy: General News, Updates and Discussions
- Thread starter Beijingwalker
- Start date
More options
Who Replied?

冖_冖
Registered Member

Banks' Panda Bonds, Cross-Border Settlements Help Fuel Chinese Yuan's Growing Global Use
DATE: a day ago
(Yicai) April 1 -- The strong driving forces of the internationalization of the Chinese yuan are clearly emerging from lenders’ annual financial statements, given their solid performance in cross-border yuan settlement and panda bond underwriting.
Bank of China helped more than 30 overseas entities issue panda bonds last year, with the total underwriting amount reaching CNY38 billion (USD5.5 billion), ranking first nationwide for the 12th consecutive year, Executive Vice President Yang Jun said during the company’s 2025 earnings conference call on March 30.
Moreover, BOC assisted 81 entities in issuing offshore Chinese yuan-denominated bonds for an underwriting amount of over CNY110 billion (USD16 billion), Yang noted.
The Chinese branches of BOC handled about CNY18 trillion (USD2.61 trillion) cross-border yuan settlements last year, accounting for one-fourth of the total market, according to the lender’s financial statement. Of that, over 30 percent was for goods trade.
BOC’s top customer service coverage rate of cross-border e-commerce exceeded 80 percent, with the yuan settlement volume surpassing CNY1 trillion, accounting for over 90 percent of the total.
Industrial and Commercial Bank of China underwrote 46 panda bonds for 28 issuers last year, with the amount reaching CNY25.5 billion, according to its 2025 earnings statement. It was the lead underwriter of the first panda bonds issued by a US entity, an African international development institution, and a UK entity, as well as of multiple sovereign panda bonds issued by Belt and Road Initiative member countries.
ICBC’s cross-border yuan settlement business exceeded CNY10 trillion last year.
China Construction Bank underwrote 21 panda bonds worth a total of CNY13.1 billion last year, up 62 percent and 128 percent, respectively, from 2024, the firm said in its 2025 financial report. CCB’s cross-border yuan settlement business reached CNY6.5 trillion (USD945.7 billion), achieving double-digit growth.
Panda bonds are yuan-denominated bonds issued by overseas institutions in China. Governments of multiple countries, international development institutions, financial institutions, and large enterprises sold more than CNY170 billion panda bonds last year, Pan Gongsheng, governor of the People’s Bank of China, said at the annual conference of the China Development Forum.
China’s low interest rates, the inversion of the interest rate differential between China and the United States, and the institutional opening-up of China’s bond market are the core reasons for the popularity of panda bonds, according to industry insiders.
The institutional opening-up of China’s bond market and capital account has made issuing panda bonds more attractive to foreign entities, Zhang Ming, deputy director of the Institute of World Economics and Politics at the Chinese Academy of Social Sciences, said in an article.
The continuous advancement of the yuan internationalization has significantly hiked the genuine demand of foreign entities for yuan-denominated funds, he added.
The risk-free interest rate and credit spreads in China are relatively low, so the cost for foreign entities to issue panda bonds is lower than that of issuing bonds in the international market, said Guo Zairan, researcher at the fixed income department of CIB Research.
As investors, commercial banks can obtain excess returns by underwriting panda bonds, Guo noted, adding that after deducting the hedging costs, it may not be less advantageous than investing in foreign currency bonds.
The panda bond market is expected to expand further in the future, with more diversified market participants, according to a research report by CSCI Pengyuan Ratings. Market rules may be further aligned with international standards, and related innovative products may become more abundant.
Beijingwalker
VIP Member
- Thread starter
- #1,458
Last edited:
Beijingwalker
VIP Member
- Thread starter
- #1,459
China Beats U.S. in 2025 Global Approval Ratings
The communist nation has beaten the U.S. twice before, but this year the margin is the largest in the last 20 years.By Davi Schulman
April 3, 2026, at 2:01 a.m.

REUTERS
The national flag of the People's Republic of China flutters in the wind at Tiananmen Square in Beijing, China, March 3, 2026. REUTERS/Maxim Shemetov
China topped the U.S. by the largest margin in the past 20 years in a new Gallup global approval ratings report.
China’s median global approval rating – how other countries view the job performance of its leadership – rose to 36% in 2025, while the U.S. rating fell to 31%. This represents a 13% increase in China’s rating and a 21% decrease in the U.S. rating from 2024.
Before 2025, China had surpassed the U.S. in approval ratings twice in the past two decades: during George W. Bush’s administration and the first Trump administration. Global approval of Chinese leadership has remained well below the U.S. since 2020 – until 2025.

While China did improve in its global approval rating, the large margin when compared to the U.S. reflects a decline in the approval rating for the U.S.
“How your country is relating to these other countries definitely, I think, factors into how people are perceiving it,” says Julie Ray, managing editor for world news at Gallup.
Disapproval ratings for the U.S. also rose to a record-high 48% in 2025, the first year of President Donald Trump’s second administration. China’s disapproval rating in 2025 remained stagnant at 37%.
Though China is besting the U.S., this isn’t the lowest approval rating the nation has received. Since Gallup began recording 20 years ago, the lowest rating for the U.S. was 30% in the first and last years of Trump’s first term. The highest was 49% approval during Obama’s first term in 2009.
To gather this data, Gallup asked residents of every country included in its annual World Poll to rate the leadership of the four leading economic or military powers: the U.S., China, Russia and Germany. The survey does not define leadership, so it is up to the interpretation of the respondent to decide who or what constitutes a country’s leadership.
The latest results come from 2025 Gallup surveys conducted in more than 130 countries. Gallup notes that this data predates the U.S. withdrawal from 66 international organizations in January and the start of the Iran war in late February.
Germany maintained its standing as the major world power with the highest approval ratings, achieving 48% in 2025. Russia – almost always the lowest of the four – held its spot at the bottom and had a median global approval rating of 26%.
In 44 countries last year – especially NATO partners of the U.S. – approval of American leadership decreased by 10 points or more. Germany’s approval of U.S. leadership dropped the most by 39 points.
Unlike most other U.S. allies, Israel’s ratings of U.S. leadership rose by more than 10 points to 76% – the second highest of all countries. Ray points to Israel’s war with Hamas and says that the “situation on the ground definitely does matter to how people are viewing things and how they’re locally impacted.”
Notably, the global median of respondents who said they didn’t know or refused to answer the leadership approval question about the U.S. and China has continued to drop significantly, suggesting that more people have strong feelings about the two countries. “Maybe this reflects that Trump is more of a known quantity at this stage,” says Ray. She also says that China has increased in global visibility.
This new data is one more piece of information that people – particularly policymakers and business people – can use to inform their decisions, says Ray. It also shows people they aren’t necessarily alone in their views of the world.
“This gives a voice to some people who don’t get to be heard from a lot,” she says.
FHN
Trusted Member
According to industry sources on April 2, YMTC plans to begin mass production of its most advanced NAND products at Wuhan Fab 3 in Hubei Province starting H2 2026. A source familiar with the situation in China noted: "Wuhan Fab 1 and Fab 2 are already known to be operating near maximum capacity, and Fab 3 — the newest facility — is in the final stages of critical equipment setup ahead of full-scale production."YMTC has expanded its presence in the global NAND market at a remarkable pace over the past two years. Wuhan Fab 2, which began operations in 2024, reportedly reached maximum capacity in just two years. The line currently produces an average of 60,000 wafers per month, while Fab 1, the largest facility, produces 100,000 wafers per month. Annual production volume grew from 1.29 million wafers in 2024 to 1.77 million last year, and is expected to approach 2 million this year.Once Wuhan Fab 3 is fully operational, YMTC is set to overtake SK Hynix and Micron in shipment volume, securing the number three position in the global NAND market — trailing only Kioxia (4.82 million wafers) and Samsung Electronics (4.68 million wafers). Notably, YMTC has been steadily increasing its mix of high-complexity 200+ layer NAND across server and mobile segments, moving beyond legacy products, and is expected to stabilize yields on 300-layer products this year.YMTC's revenue portfolio — historically skewed toward Chinese domestic customers and one of the key reasons the company has been underestimated — is also likely to shift this year. According to Reuters and other outlets, Apple is reportedly evaluating the use of YMTC products due to NAND supply constraints. Apple is said to be concerned about margin compression on major product lines including iPhone, driven by rising DRAM and NAND prices, and has begun considering YMTC as an alternative supplier.While a formal supply agreement with Apple remains uncertain, the prevailing view is that such a deal would be transformative for YMTC. Apple is not just another revenue source — qualifying as an Apple supplier carries significant symbolic weight, as it signals that a company has passed rigorous quality, reliability, and supply stability assessments. If Apple supply is confirmed, other Big Tech companies facing NAND shortages could also begin considering YMTC as an alternative.An industry source noted: "If YMTC supplies NAND to Apple, it would represent a symbolic re-entry into the supply chains of global top-tier OEMs, breaking free from its China-centric customer base. Given that Apple has historically sourced NAND from Samsung, SK Hynix, and Kioxia, YMTC's market positioning would fundamentally change."
冖_冖
Registered Member
China Sets 2029 Deadline to Shut Down Outdated Petrochemical Plants | OilPrice.com
China has ordered the phase-out of outdated petrochemical plants by 2029, with upgrades for others, as overcapacity hammers margins across Asia.
 oilprice.com
China Sets 2029 Deadline to Shut Down Outdated Petrochemical Plants
Apr 03, 2026, 7:00 AM CDTChina plans to phase out some of its outdated petrochemical plants by 2029 and upgrade others, under new directives issued by the authorities on Friday.
The Chinese authorities will review which facilities will be upgraded and which will be closed, using lists of outdated petrochemical plants compiled by local governments in recent months, according to documents by the central government cited by Reuters.
China and its refiners and petrochemical producers have been struggling with low margins amid overcapacity and falling demand for road transportation fuels. The Chinese authorities last year stepped up efforts to curb overcapacity that has led to refining losses and thin petrochemical margins amid a glut of producing units that has overwhelmed the entire Asian market.
China is already the world's biggest producer of ethylene and polyethylene, after building seven petrochemical complexes over the past ten years. Previously, the United States was the biggest producer of the petrochemical commodities.
Yet, refining and chemicals firms have not been spared from the so-called “involution” in China, which refers to excessive and self-defeating competition among Chinese companies for limited resources and opportunities.
At the end of last year, the buildout in new petrochemical capacity in China fueled fears that the country could tip the global market into oversupply, hurting smaller petrochemical producers.
China is relatively resilient amid the current global oil and products crunch, which is reducing naphtha supplies in Asia and hurting the petrochemical industries in South Korea and Japan.
China is somewhat different from the rest of the Asian market, as it benefits from large volumes of coal?to?chemicals capacity and extensive world?scale refinery?chemicals complexes, analysts at ICIS said last week.
AViet
Trusted Member

Here is WIPO report 2026 summary:
International patent applications by origin (PCT System) Origin 2024 2025 Estimate Origin
1. China: 73,718 patent filling in 2025
2. US: 52,617
3. Japan: 47,922
4. Korea: 25,016
5. Germany: 16,441
6. France: 7,778
7. UK: 5,809
(all European combined (including Russia) is around 61.000)
....
12.India: 3,070
15. Singapore: 2,189
19. Israel: 1,583
Thailand: 167
Malaysia: 130
Colombia: 63
Bulgaria: 60
Egypt: 59
Romania: 50
Vietnam: 20
Top PCT applicants
1. Huawei: 7,523
2. Samsung: 4,698
3. Qualcomm (US): 3,227
4. LG: 2,400
5. CATL: 2,203
6. Panasonic: 2,294
7. LG: 1,958
8. BOE technology: 1,945
9. Xiaomi: 1,921
10. Mitsubishi: 1,835
...
14. Bosch (Germany): 1,306 (it used to rank 3rd or 4th place, just some years ago)
28. Apple Inc (US): 812
Top PCT applicants by educational institution
1. University of California (US): 488
2. Tsinghua University (China) 227
3. University of Texas (US): 226
4. Leland Stanford University (US): 179
5. MIT (US): 170
6. John Hopkin University (US): 153
6. Seoul National University (Korea): 153
8. Zhejiang University (China): 144
9. University of Michigan (US): 123
10. University of Tokyo: 116
10. Tohoku University (Japan): 116
10. Hanyang university (Korea): 116
13. Nanyang university (Singapore): 110
14. Southeast University (China): 109
15. National university of Singapore: 105
Data of Taiwan is not included in the report because of objection from China, but unofficial estimate is around 20,000 patent fillings in 2025.
Last edited:
Beijingwalker
VIP Member
- Thread starter
- #1,466
US retains top spot as China narrows gap; check top 7 countries in Global Soft Power Index 2026
The United States continues to lead the Global Soft Power Index 2026, maintaining its dominance through cultural influence, diplomacy, and global outreach, even as China rapidly closes the gap with expanding economic and strategic presence. Here is the top seven countries from the Brand Finance Global Soft Power Index 2026, which ranks 193 nations based on global perceptions of their attractiveness, influence, and reputation. The index draws from surveys of over 150,000 respondents across 100+ markets, evaluating factors like familiarity, reputation, influence, culture, governance, business & trade, education & science, and more.Updated:Apr 04, 2026, 02:33 PM IST
United States (Score-74.9)
The US retains the top spot despite recording the steepest decline (-4.6 points). It excels in arts & entertainment, media influence, global brands, science & technology, and diplomatic reach, driven by Hollywood, tech giants, and cultural exports. However, perceptions in governance and values have softened amid geopolitical shifts.China (Score-73.5)
China has narrows the gap with the US (now just 1.4 points behind) and is the only top-10 nation to see its score rise (+0.7). It performs strongly in business & trade, economic stability messaging, and infrastructure perceptions, positioning itself as a credible alternative on the world stage.Japan (Score-70.6)
Japan overtook the UK to secure 3rd place, thanks to its strengths in sustainability, education, products & brands, and "lived experience" appeal through tourism, technology, and culture. It earned the highest total medals (26) in the index's granular categories.United Kingdom (Score- 69.2)
The UK drops to 4th (its lowest position ever, -3.2 points) amid declines in reputation and people & values perceptions. Having said that, it still benefits from strong media, heritage, and international relations influence but faces challenges in a shifting global mood.Germany (Score- 67.7)
Germany is in 5th place but sees a notable decline, specifically in economic stability, science & technology leadership, and diplomatic perceptions. Its engineering excellence and reliability remain core strengths.France (Score- 65.8)
France ranks 6th, leveraging its cultural heritage, arts, luxury brands, and diplomatic influence (including cuisine, fashion, and international institutions). It maintains solid appeal in lifestyle and heritage categories.Switzerland (Score- 63.2)
Switzerland bags 7th spot and dominates the "medal table" with 17 gold medals across metrics like reputation, governance, international relations, and economic strength. It is widely seen as a benchmark for trust, stability, neutrality, and quality of life.ety
Trusted Member

The Iran war will cement China’s superpower status.
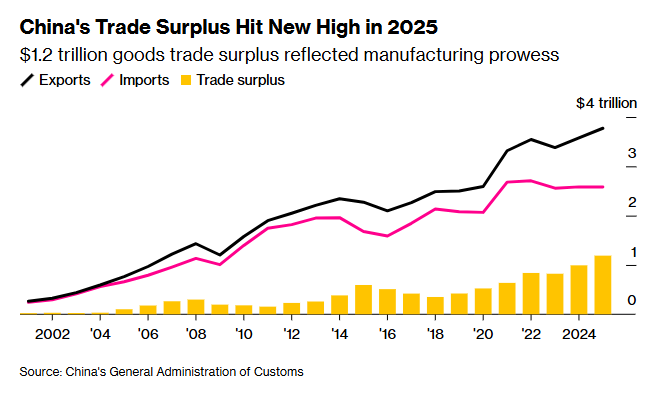
Beijing’s industrial prowess positions it for economic and diplomatic gains
Tej Parikh

Chinese premier Li Qiang last week convened more than 70 global chief executives to tout China’s stability and supply chains in the wake of the Middle East conflict © Qilai Shen/Bloomberg
As the world’s biggest oil importer, the Iran war poses a significant threat to China. But Beijing has been preparing for a crisis like this for years and is well positioned to turn the conflict into an advantage in the race for global economic supremacy.
Last year, China imported about half of its crude oil and almost one-third of its liquefied natural gas from the Middle East. But it has aggressively built up strategic stockpiles of fossil fuels. China is estimated to hold the world’s largest emergency reserves of petroleum, totalling 1.3bn barrels.
Even so, Iran has said vessels linked to “non-hostile” partners — which includes Beijing — can traverse the Strait of Hormuz. Almost half of China’s imported gas is piped from Russia and Turkmenistan on long-term contracts. Moreover, the Chinese Communist Party has already leveraged its centralised power to restrict exports from the country’s refineries, and could use it to hold down prices and pivot to alternative energy sources too.
Besides, China has made significant investments in electrification. Electricity accounts for 30 per cent of the country’s energy consumption, about 50 per cent higher than the US or Europe, making it more insulated from rising global oil prices. (With its rapid solar and wind build-out, it already accounts for roughly one-third of renewable energy generation capacity worldwide.)
A diverse energy mix, multiple suppliers and access to routes that bypass the Gulf mean only about 6 per cent of China’s total energy consumption is directly exposed to disruptions in the strait, estimates Goldman Sachs.
In sum, China could weather a conflict that lasts for several more months, while greater protection from global energy prices will make its exporters more competitive.
Beijing’s bet on cleantech and end-to-end industrial independence means it can make lasting economic and diplomatic gains from the war, too.
First, the conflict has underscored the importance of reducing reliance on hydrocarbon imports. Chinese firms account for at least 70 per cent of global manufacturing capacity for major green technologies, including solar, battery and electric vehicle components. The country also dominates the extraction and refining of the rare-earth elements that go into them.
Reflecting this, investors have rushed into the country’s green energy stocks in anticipation of rising global demand for renewables. China’s top battery makers have gained more than $70bn in market capitalisation since the US and Israel attacked Iran.
Next, with nations relying on resources via the Middle East, China can position itself as a supplier of last resort given its stockpile of fossil fuels and industry-critical materials. It is also a net exporter of refined petroleum. (Taiwan, for instance, has already rebuffed Beijing’s offer of energy support.)
China is the world’s second-largest exporter of fertiliser. Though it has restricted exports to bolster domestic security, it could act as a buffer to nations facing agricultural distress. It also has strategic reserves of sulphur, a key element in plant feed and metal processing, which is widely sourced via the strait.
Likewise, the country has made progress in reducing its dependence on helium imports, with the recent discovery of a large domestic reserve and reported breakthroughs in purification. As outlined in last week’s edition, supplies of the chemical from Qatar are vital in Asia’s chip industry. (I spoke to CNN and The Tech Report about this.)
A lengthy war could also give Beijing leverage ahead of a proposed meeting in May between Chinese President Xi Jinping and US President Donald Trump, notes Agathe Demarais, senior policy fellow at the European Council on Foreign Relations. “Many of the missiles, fighter jets and other weapons that America needs for its war effort run on Chinese-made rare earths. But the US has only about two months of stocks,” she said.
China’s strong relations with Gulf nations and its record in developing infrastructure mean its companies are in pole position to rebuild the region after the war, added Demarais. “They can provide finance and the materials to revive ports, energy facilities and desalination plants.
”Beijing’s efforts to raise the renminbi’s global standing might get a boost from the war as well. A shift away from dollar-denominated oil towards domestic energy and Chinese green tech will play a part. Iran is also reportedly negotiating with some nations to permit the passage of ships, provided payments are made in yuan.
“The conflict could be the catalyst for an erosion in petrodollar dominance and the beginnings of the ‘petroyuan’,” argues Deutsche Bank strategist Mallika Sachdeva. In other words, Trump’s war could normalise non-dollar energy sales.
Finally, the conflict boosts China’s image as a more stable partner relative to the US across the developed and developing world. Just last week Chinese premier Li Qiang convened more than 70 global chief executives at the China Development Forum to tout the country’s reliability and supply chains. China’s favourability compared to the US is indeed rising, exclusive survey data from Morning Consult shows.
China’s economy won’t emerge unscathed. As the war goes on, the country will face rising costs, tighter supplies and the risk of further rationing. In a prolonged conflict scenario, a deep global recession would hurt demand for its exports. Foreign partners will also remain wary of trade imbalances and becoming too dependent on the nation.
But those expecting the war to undermine China’s superpower status — a view common among Maga types — are badly mistaken. Beijing’s long-termism, diversification and nimbleness make the country uniquely resilient, and well positioned to exploit new openings.

 www.ft.com
Beijing’s industrial prowess positions it for economic and diplomatic gains
Tej Parikh
Chinese premier Li Qiang last week convened more than 70 global chief executives to tout China’s stability and supply chains in the wake of the Middle East conflict © Qilai Shen/Bloomberg
As the world’s biggest oil importer, the Iran war poses a significant threat to China. But Beijing has been preparing for a crisis like this for years and is well positioned to turn the conflict into an advantage in the race for global economic supremacy.
Last year, China imported about half of its crude oil and almost one-third of its liquefied natural gas from the Middle East. But it has aggressively built up strategic stockpiles of fossil fuels. China is estimated to hold the world’s largest emergency reserves of petroleum, totalling 1.3bn barrels.
Even so, Iran has said vessels linked to “non-hostile” partners — which includes Beijing — can traverse the Strait of Hormuz. Almost half of China’s imported gas is piped from Russia and Turkmenistan on long-term contracts. Moreover, the Chinese Communist Party has already leveraged its centralised power to restrict exports from the country’s refineries, and could use it to hold down prices and pivot to alternative energy sources too.
Besides, China has made significant investments in electrification. Electricity accounts for 30 per cent of the country’s energy consumption, about 50 per cent higher than the US or Europe, making it more insulated from rising global oil prices. (With its rapid solar and wind build-out, it already accounts for roughly one-third of renewable energy generation capacity worldwide.)
A diverse energy mix, multiple suppliers and access to routes that bypass the Gulf mean only about 6 per cent of China’s total energy consumption is directly exposed to disruptions in the strait, estimates Goldman Sachs.
In sum, China could weather a conflict that lasts for several more months, while greater protection from global energy prices will make its exporters more competitive.
Beijing’s bet on cleantech and end-to-end industrial independence means it can make lasting economic and diplomatic gains from the war, too.
First, the conflict has underscored the importance of reducing reliance on hydrocarbon imports. Chinese firms account for at least 70 per cent of global manufacturing capacity for major green technologies, including solar, battery and electric vehicle components. The country also dominates the extraction and refining of the rare-earth elements that go into them.
Reflecting this, investors have rushed into the country’s green energy stocks in anticipation of rising global demand for renewables. China’s top battery makers have gained more than $70bn in market capitalisation since the US and Israel attacked Iran.
Next, with nations relying on resources via the Middle East, China can position itself as a supplier of last resort given its stockpile of fossil fuels and industry-critical materials. It is also a net exporter of refined petroleum. (Taiwan, for instance, has already rebuffed Beijing’s offer of energy support.)
China is the world’s second-largest exporter of fertiliser. Though it has restricted exports to bolster domestic security, it could act as a buffer to nations facing agricultural distress. It also has strategic reserves of sulphur, a key element in plant feed and metal processing, which is widely sourced via the strait.
Likewise, the country has made progress in reducing its dependence on helium imports, with the recent discovery of a large domestic reserve and reported breakthroughs in purification. As outlined in last week’s edition, supplies of the chemical from Qatar are vital in Asia’s chip industry. (I spoke to CNN and The Tech Report about this.)
A lengthy war could also give Beijing leverage ahead of a proposed meeting in May between Chinese President Xi Jinping and US President Donald Trump, notes Agathe Demarais, senior policy fellow at the European Council on Foreign Relations. “Many of the missiles, fighter jets and other weapons that America needs for its war effort run on Chinese-made rare earths. But the US has only about two months of stocks,” she said.
China’s strong relations with Gulf nations and its record in developing infrastructure mean its companies are in pole position to rebuild the region after the war, added Demarais. “They can provide finance and the materials to revive ports, energy facilities and desalination plants.
”Beijing’s efforts to raise the renminbi’s global standing might get a boost from the war as well. A shift away from dollar-denominated oil towards domestic energy and Chinese green tech will play a part. Iran is also reportedly negotiating with some nations to permit the passage of ships, provided payments are made in yuan.
“The conflict could be the catalyst for an erosion in petrodollar dominance and the beginnings of the ‘petroyuan’,” argues Deutsche Bank strategist Mallika Sachdeva. In other words, Trump’s war could normalise non-dollar energy sales.
Finally, the conflict boosts China’s image as a more stable partner relative to the US across the developed and developing world. Just last week Chinese premier Li Qiang convened more than 70 global chief executives at the China Development Forum to tout the country’s reliability and supply chains. China’s favourability compared to the US is indeed rising, exclusive survey data from Morning Consult shows.
China’s economy won’t emerge unscathed. As the war goes on, the country will face rising costs, tighter supplies and the risk of further rationing. In a prolonged conflict scenario, a deep global recession would hurt demand for its exports. Foreign partners will also remain wary of trade imbalances and becoming too dependent on the nation.
But those expecting the war to undermine China’s superpower status — a view common among Maga types — are badly mistaken. Beijing’s long-termism, diversification and nimbleness make the country uniquely resilient, and well positioned to exploit new openings.
The Iran war will cement China’s superpower status
Beijing’s industrial prowess positions it for economic and diplomatic gains
ety
Trusted Member
So, the super-sized supa powa Bharat is literally in the same category as the tiny city state Singapore. What a disgrace,Here is WIPO report 2026 summary:
International patent applications by origin (PCT System) Origin 2024 2025 Estimate Origin
1. China: 73,718 patent filling in 2025
2. US: 52,617
3. Japan: 47,922
4. Korea: 25,016
5. Germany: 16,441
6. France: 7,778
7. UK: 5,809
(all European combined (including Russia) is around 61.000)
....
12.India: 3,070
15. Singapore: 2,189
19. Israel: 1,583
Thailand: 167
Malaysia: 130
Colombia: 63
Bulgaria: 60
Egypt: 59
Romania: 50
Vietnam: 20
Top PCT applicants
1. Huawei: 7,523
2. Samsung: 4,698
3. Qualcomm (US): 3,227
4. LG: 2,400
5. CATL: 2,203
6. Panasonic: 2,294
7. LG: 1,958
8. BOE technology: 1,945
9. Xiaomi: 1,921
10. Mitsubishi: 1,835
...
14. Bosch (Germany): 1,306 (it used to rank 3rd or 4th place, just some years ago)
28. Apple Inc (US): 812
Top PCT applicants by educational institution
1. University of California (US): 488
2. Tsinghua University (China) 227
3. University of Texas (US): 226
4. Leland Stanford University (US): 179
5. MIT (US): 170
6. John Hopkin University (US): 153
6. Seoul National University (Korea): 153
8. Zhejiang University (China): 144
9. University of Michigan (US): 123
10. University of Tokyo: 116
10. Tohoku University (Japan): 116
10. Hanyang university (Korea): 116
13. Nanyang university (Singapore): 110
14. Southeast University (China): 109
15. National university of Singapore: 105
Data of Taiwan is not included in the report because of objection from China, but unofficial estimate is around 20,000 patent fillings in 2025.
Users who are viewing this thread
Total: 4 (members: 0, guests: 4)
Pakistan Defence Latest
-
Why China Will Not Sell 5th-Generation J-35 Fighter Jets to Pakistan (Yet) (19 Viewers)
- Latest: wangdefa
-
 Robotics & Autonomous Systems (RAS) Exhibition in Islamabad (22-23 July 2026) (2 Viewers)
- Latest: hydrabadi_arab
-
-

-

Country Watch Latest
-
Iran - Israel/US War: Israel-US declare war on Iran, Iran responds (434 Viewers)
- Latest: Hassan Al-Somal
-

-

-

-

Latest Posts
-
Iran - Israel/US War: Israel-US declare war on Iran, Iran responds (434 Viewers)
- Latest: Hassan Al-Somal
-

-
Why China Will Not Sell 5th-Generation J-35 Fighter Jets to Pakistan (Yet) (19 Viewers)
- Latest: wangdefa
-

-
