Covid-19 News and Discussions

Super Dodgy COVID Research​


Popular Covid jab reveals rare deadly side effect​


Dad who suffered brain injury days after getting COVID vaccine sues AstraZeneca​


What Is FLiRT - The New COVID-19 Variant On The Rise In The US?​


COVID hospitalizations drop below 100 as BCCDC switches to monthly reporting​

A sign at the BC Centre for Disease Control is seen in this photo from the BCCDC website.
ian-holliday-1-4645409.jpg

Ian Holliday
CTVNewsVancouver.ca Journalist
Contact
Published May 2, 2024 6:29 p.m. EDT
Share
  • Link
  • X
  • Reddit
  • LinkedIn
  • Email
The number of people with COVID-19 in B.C. hospitals dropped below 100 this week for the first time since last summer.
The latest data from the B.C. Centre for Disease Control shows 97 test-positive COVID patients in provincial hospitals, down from 105 at this time last week.

b-c--covid-19-hospitalizations-may-2--2024-1-6871468-1714688709132.png
The number of people with COVID-19 reported in provincial hospitals by the B.C. Centre for Disease Control in 2024 is shown. (CTV News)
Thursday's total is the lowest the BCCDC has reported so far in 2024, and the first time the hospitalization count has been below 100 since August 2023, when the agency reported just 76 patients in hospital.

RELATED STORIES​

That August update was a two-year low for COVID-19 hospitalizations in B.C., according to CTV News tracking of publicly released data. It was followed by a dramatic surge in September and October, growing more than five-fold to 422 test-positive patients by Oct. 5, 2023.
If this year follow's last year's pattern, the province is on pace to see an even lower summer low. Last year at this time, there were 268 people hospitalized with COVID, more than double the current total.
Of course, there's no guarantee that transmission of the disease will follow the same pattern it did last summer.
While the hospitalized population has been declining slowly and steadily in recent weeks, other data released by the BCCDC on Thursday has not necessarily followed the same pattern.
The latest update shows 254 new infections confirmed through lab-based testing during the most recent epidemiological week, which ended April 27. That's essentially unchanged from the 253 reported the week before and the 252 reported the week before that.
The percentage of tests coming back positive rose slightly during the most recent week, going from 8.8 per cent to nine per cent, largely as a result of fewer tests being conducted overall.
Whether this recent plateauing of transmission data corresponds to a plateau or slight resurgence of hospitalizations in the coming weeks will not be known until the start of June, as the BCCDC is switching from weekly to monthly reports over the summer.
Wastewater surveillance data will continue to be released weekly on the agency's website(opens in a new tab), however, and can provide some insight into general trends in virus transmission.
The latest wastewater data released Thursday shows relatively low SARS-CoV-2 concentrations at all monitored treatment plants, with most showing either stable or decreasing trends.
 
@Sharma Ji

Looks like the covid shot is not effective.


ABSTRACT​

Data evaluating effectiveness of XBB.1.5-adapted vaccines against JN.1-related endpoints are scarce. We performed a nationwide test-negative case-control study within the US Veterans Affairs Healthcare System to estimate vaccine effectiveness (VE) of BNT162b2 XBB.1.5-adapted vaccine compared to not receiving an XBB vaccine of any kind against COVID-19 hospitalization, emergency department or urgent care visits (ED/UC), and outpatient visits. Between September 25, 2023 and January 31, 2024, effectiveness was 24–35% during a period of JN.1 predominance and 50–61% during XBB predominance across all outcomes. VE within 60 days of vaccination during the likely JN.1 period was 32% (95% confidence interval 3-52%) against hospitalization, 41% (23–54%) against ED/UC visits, and 31% (1–52%) against outpatient visits. Corresponding VE during the likely XBB period was 62% (44–74%), 52% (37–63%), and 50% (25–66%) by setting, respectively. These data underscore the importance of strain match to maximize the public health impact of COVID-19 vaccination.

Competing Interest Statement​

Haley J. Appaneal has received research funding from Pfizer. Aisling R. Caffrey has received research funding from AbbVie, Merck, and Pfizer. Kerry L. LaPlante has received research funding from AbbVie, Merck, and Pfizer and has been an advisor for Ferring Pharmaceuticals, AbbVie, and Seres Therapeutics. Laura Puzniak, Evan J. Zasowski, Luis Jodar, and John M. McLaughlin are employees and shareholders of Pfizer Inc.

Funding Statement​

Pfizer provided funding to the VA Providence Healthcare System for data analysis and manuscript development. HJA, ARC, VVL and KLL are employees of the VA Providence Healthcare System.

Author Declarations​

I confirm all relevant ethical guidelines have been followed, and any necessary IRB and/or ethics committee approvals have been obtained.

Yes

The details of the IRB/oversight body that provided approval or exemption for the research described are given below:

This study was determined to be exempt by the VA Providence Healthcare System (VAPHS) Institutional Review Board (IRB) and approved by the VAPHS Research and Development Committee. As this was a retrospective study of existing health records and exempt from IRB review, informed consent requirements are not applicable.

I confirm that all necessary patient/participant consent has been obtained and the appropriate institutional forms have been archived, and that any patient/participant/sample identifiers included were not known to anyone (e.g., hospital staff, patients or participants themselves) outside the research group so cannot be used to identify individuals.

Yes

I understand that all clinical trials and any other prospective interventional studies must be registered with an ICMJE-approved registry, such as ClinicalTrials.gov. I confirm that any such study reported in the manuscript has been registered and the trial registration ID is provided (note: if posting a prospective study registered retrospectively, please provide a statement in the trial ID field explaining why the study was not registered in advance).

Yes

I have followed all appropriate research reporting guidelines, such as any relevant EQUATOR Network research reporting checklist(s) and other pertinent material, if applicable.

Yes
 

COVID-19 Update for the United States
Early Indicators
Test Positivity
% Test Positivity
3.0%
(April 21 to April 27, 2024)
Trend in % Test Positivity
-0.1% in most recent week

Emergency Department Visits
% Diagnosed as COVID-19
0.3%
(April 21 to April 27, 2024)
Trend in % Emergency Department Visits
-11% in most recent week

These early indicators represent a portion of national COVID-19 tests and emergency department visits. Wastewater information also provides early indicators of spread.
Severity Indicators
Hospitalizations
Hospital Admissions
5,098
(April 21 to April 27, 2024)
Trend in Hospital Admissions
-11.1% in most recent week

Deaths
% of All Deaths in U.S. Due to COVID-19
0.8%
(April 21 to April 27, 2024)
Trend in % COVID-19 Deaths
No change in most recent week

Total Hospitalizations
6,935,240
Total Deaths
1,190,122
CDC | Test Positivity data through: April 27, 2024; Emergency Department Visit data through: April 27, 2024; Hospitalization data through: April 27, 2024; Death data through: April 27, 2024.
Posted: May 3, 2024 12:00 PM ET
 

r/CoronavirusDownunder•2 days ago

Weekly case numbers from around Australia: 6,911 new cases (🔺50% see note)​

Australia: Case Update

Note that WA has ~1350 additional cases this week, rather than the expected ~300 cases. WA wastewater monitoring only suggests a small increase in cases. The ACT removed ~100 cases.
Adjusting for these drop national cases to 5700, which is still a 23% weekly increase, mostly from VIC, and a lesser extend SA and NSW.
  • NSW 1,851 new cases (🔺18%)
  • VIC 1,160 new cases (🔺78%)
  • QLD 990 new cases (🔺3%)
  • WA 1,646 new cases (🔺449% likely data correction)
  • SA 1,222 new cases (🔺30%)
  • TAS 78 new cases (🔻5%)
  • ACT -96 new cases (🔻235% data correction)
  • NT 60 new cases (🔺107%)
Additional notes:
  • Case data is from NNDSS Dashboard that is automated from CovidLive
  • These case numbers are only an indicator for the current trends as most cases are unreported.
  • Multiply by 20 or 30 to get a better indication of actual community case numbers.
  • Only SA still collect or report RAT results.
Victoria is starting to show a steady increase in hospitalisations again, suggesting it's in a new wave, although this is not really showing up in the other states yet.
r/CoronavirusDownunder - Victoria Hospitalisations
Victoria Hospitalisations
JN.1.* sub-linages continue to dominate here, especially the convergence of multiple variants to common sequences such as JN.1.* + S:F456L, but globally absolute numbers are still falling.
r/CoronavirusDownunder - NSW Variants
NSW Variants
Flu tracker tracks cold and flu symptoms (fever plus cough) and is another useful tool for tracking the level of respiratory viruses in the community. This has fallen by 0.1% nationally this week to 1.4%.
  • NSW: 1.7% this week compared to 1.6% last week
  • VIC: 1.3% this week compared to 1.1% last week
  • QLD: 0.9% this week compared to 1.7% last week
  • SA: 1% this week compared to 1.6% last week
  • WA: 1.4% this week compared to 0.9% last week
  • TAS: 1.5% this week compared to 1.8% last week
  • ACT: 1.7% this week compared to 1.7% last week
  • NT: 2.1% this week compared to 3.1% last week
 

COVID-19: Current cases​

Read the latest information about confirmed and probable cases of COVID-19 in New Zealand.
This data is updated weekly. All data on this page relates to cases recorded prior to 11:59 pm 28 April 2024.
Whatu Tāniko pattern

On this page​

Last updated 2pm 29 April 2024.
This data is updated weekly. All data on this page relates to cases recorded prior to 11:59 pm 28 April 2024.

COVID-19 cases summary​

New case average* RATs uploaded average*
335 ↓ 366 ↓
Cases in hospital as at midnight SundayCases in ICU as at midnight Sunday
159 0
Deaths attributed to COVID*Total deaths attributed COVID
2 ↓ 3,976
* 7 day rolling average
** Not currently available

Current situation​

Summary
In the last weekNew cases reported2343
Reinfections1445
Reinfections (< 90 days)31
Total since first New Zealand caseCases reported2631839
Reinfections361385
Reinfections (< 90 days)26391

Case outcomes since first New Zealand case

COVID-19 casesChange in the last weekTotal
Recovered23692625523
Deceased*113976*
*The Ministry of Health has recently switched its definition of 'deceased' from deaths within 28 days of testing positive for COVID-19 to deaths attributed to COVID-19. See the definitions section below for further details.

Deaths with COVID-19​

Cause of deathDied within 28 days of positive testDied more than 28 days after positive testTotalChange in the last week
COVID as underlying237012524956
COVID as contributory137410714815
COVID-attributed total3744232397611
Not COVID18130*18138
Not available232023210
Total5789232602129*
*The change in total deaths with COVID may not be equal to the number of new deaths reported today. This is because deaths that occurred more than 28 days after a positive test that are subsequently determined to be unrelated to COVID are removed from the total.
Of the 29 people whose deaths we are reporting today: six were from Auckland region, three were from Waikato, one was from Taranaki, one was from MidCentral, six were from Wellington region, two were from Nelson Marlborough, four were from Canterbury, five were from Southern, one was unknown.
Two were in their 60s, five were in their 70s, 14 were in their 80s and eight were aged over 90. Of these people, ten were women and 19 were men.

Case details​

Number of active cases
Change in the last weekTotal since first NZ case
Confirmed20262587178
Probable31744661
Total2343*263139
*The change in total case numbers may not be equal to the number of new cases reported today due to data updating and reconciliation.

Definitions​

Active case - confirmedConfirmed cases are people who have received a positive PCR test OR someone who has received a positive result on a Rapid Antigen Test. For more details, see the COVID-19 case definition.
Active case - probableA probable case is when someone is diagnosed based on their exposure to other people with COVID-19 and on their symptoms.
ReinfectionsReinfections are cases in an individual who reported a case 29 or more days previously.
RecoveredRecovered cases are people who had the virus, where at least 7 days have passed since their symptoms started and they have not had symptoms for 72 hours, and they have been cleared by the health professional responsible for their monitoring.
DeceasedIncludes all deaths where COVID-19 is determined to have been the underlying cause of death or a contributory cause of death.

Cases reported each day​

Daily confirmed and probable cases​

New COVID-19 cases reported each day

This graph shows the count of all cases of COVID-19 every day (all cases – confirmed and probable) since the first New Zealand case in late February 2020. The graph shows the rapid increase of daily cases from mid-February 2022 to early March 2022, driven by the Omicron variant.
From mid-March to mid-April 2022, cases rapidly declined, followed by a period of slower decline until early July. This was followed by a rapid increase in cases, peaking in August before a steady decline in new daily cases. Reported new daily cases hit their lowest since February 2022 in September 2022.
New COVID-19 cases reported each day
This graph shows the count of all cases of COVID-19 every day (all cases – confirmed and probable) since the first New Zealand case in late February 2020. The graph shows the rapid increase of daily cases from mid-February 2022 to early March 2022, driven by the Omicron variant. From mid-March to mid-April 2022, cases rapidly declined, followed by a period of slower decline until early July. This was followed by a rapid increase in cases, peaking in August before a steady decline in new daily cases. Reported new daily cases hit their lowest since February 2022 in September 2022.

COVID-19 by location​

Total cases by location​

Total COVID-19 cases by location graph

This bar graph shows the total cases and their status by health district and those with recent travel history.
The ‘At the border’ data group includes cases detected in managed isolation or quarantine facilities from the period when these were operating, as well as cases with recent travel history from after that time. They are not included in the district totals. Before 17 June, people in managed isolation or quarantine facilities were included in the total of the relevant district.
Total COVID-19 cases by location graph
This bar graph shows the total cases and their status by health district and those with recent travel history.
The ‘At the border’ data group includes cases detected in managed isolation or quarantine facilities from the period when these were operating, as well as cases with recent travel history from after that time. They are not included in the district totals. Before 17 June, people in managed isolation or quarantine facilities were included in the total of the relevant district.

Total cases by location​

LocationActiveRecoveredDeceasedTotalNew cases in the last week
Auckland155247091268247514153
Bay of Plenty107115541186115834107
Canterbury399347960551348910399
Capital and Coast217186376183186776218
Counties Manukau183293823321294327184
Hawke's Bay39863701688657739
Hutt Valley9791093989128897
Lakes28515581115169728
Mid Central1639705420697423163
Nelson Marlborough1108005615780323110
Northland1098150514781761110
South Canterbury2834858443493028
Southern185193229379193793186
Tairāwhiti1326705442676213
Taranaki49660251296620349
Unknown42280922935
Waikato169209336397209902169
Wairarapa4225766642587242
Waitematā212311077408311697212
West Coast1515902221593915
Whanganui1634626783472016
At the Border*027292627298NA
Total23402625523397626318392343
* Due to retiring the COVID-19 Protection Framework on 12 September 2022, the Ministry of Health no longer separately reports COVID-19 cases who have recently travelled overseas. These cases will be included in the weekly reporting on all COVID-19 community cases, but we will no longer distinguish between border and other cases.
You can also view a detailed breakdown of daily case numbers for each district since the beginning of the pandemic by clicking the ‘download’ button on the right hand side of this page: New Zealand COVID-19 data.

Note: we cannot give detailed information about cases in your district, city or town, as we must protect the privacy of the people concerned.

Also in this section​

Last updated: 29 April 2024
 

The COVID variant that now accounts for almost every case in NSW​

Angus Thomson

ByAngus Thomson

May 2, 2024 — 4.44pm
Save


Share
Normal text sizeLarger text sizeVery large text size
19
View all comments

Advertisement


Listen to this article
3 min

Experts are urging Australians needing a COVID-19 booster to get one ahead of a potential winter wave, warning a monovalent vaccine targeting the dominant JN.1 variant is unlikely to be ready in time for the colder months.
The latest NSW Health respiratory surveillance report released on Thursday shows the JN.1 variant now accounts for almost all COVID-19 cases in NSW.
The World Health Organisation reported last week that nearly all circulating COVID variants were derived from JN.1, and recommended future vaccine formulations should target the variant that has rapidly displaced all others since it was first declared a variant of interest in December.

CREDIT: NSW HEALTH
While those updated vaccines may be available for the northern-hemisphere winter, Deakin University epidemiologist Professor Catherine Bennett said it was more likely to be the vaccine Australians get “next year or in six months’ time”.

“The point is, don’t wait for this next magic booster,” she said. “It’s good to see we’ve got this capacity now to keep monitoring what’s happening with the virus [variants] but ... for now, the main focus is to try and get ahead of a wave with your vaccination to give yourself time before your exposure risk goes up in the community.”

RELATED ARTICLE​

A new COVID variant is taking over in NSW and Victoria.

Analysis​

Coronavirus pandemic

What’s JN.1? Meet the new COVID-19 variant doubling hospitalisations

Bennett said current vaccines still worked well but a “monovalent” immunisation (focused on a single strain) would be more effective at creating an antibody response to the virus and any future variants that evolve from it.
“It becomes more like the annual flu shot where we try and build our vaccines to be closest to the circulating strains,” Bennett said. “You just want to try and get the greatest effectiveness you can from your vaccines – particularly for people who are really still relying on vaccine-induced immunity as their main protection.”
Associate Professor Stuart Turville, a virologist at Sydney’s Kirby Institute, said the pace at which JN.1 had spread and evolved to better evade the body’s immune system showed it would be difficult to predict what future variants should be targeted by new vaccines.

Advertisement

“By the time we get it [a monovalent JN.1 vaccine], there’s going to be another variant, and that will be a bit different again,” he said.

RELATED ARTICLE​

Collection of radiographs show the effects of mycoplasma pneumoniae on the lungs of children. Source: Cho et al (2019)

Exclusive​

Children's Health

‘The cough that keeps on giving’: Why your child keeps getting pneumonia

Turville said older vaccines shouldn’t be ignored when updated versions come out as it’s important we build a “broad response across multiple variants”.
“I agree with the approach, we should change it over time … but I think sometimes the vaccine that’s available to you still does a pretty good job,” he said. “Just because one vaccine is the new beaut thing on the market, it doesn’t always turn out that it’s the one that reacts best to the thing that’s circulating in the future.”
Overall COVID cases remain well down on the mid-January peak, falling by 9 per cent in NSW in the past week. The trend is reflected in emergency department visits and NSW Health’s sewage surveillance program.

Cases of the flu rose by 24 per cent over the past week, while there was a 15 per cent decrease in RSV.
 
@Sharma Ji
23% efficacy sucks


Effectiveness of the 2023-2024 Formulation of the Coronavirus Disease 2019 mRNA Vaccine against the JN.1 Variant​

View ORCID ProfileNabin K. Shrestha, Patrick C. Burke, View ORCID ProfileAmy S. Nowacki, Steven M. Gordon
doi: https://doi.org/10.1101/2024.04.27.24306378
This article is a preprint and has not been peer-reviewed [what does this mean?]. It reports new medical research that has yet to be evaluated and so should not be used to guide clinical practice.

ABSTRACT​

Background The purpose of this study was to evaluate whether the 2023-2024 formulation of the COVID-19 mRNA vaccine protects against COVID-19 caused by the JN.1 lineage of SARS-CoV-2.
Methods Employees of Cleveland Clinic in employment when the JN.1 lineage of SARS-CoV2 became the dominant circulating strain, were included. Cumulative incidence of COVID-19 was examined prospectively. Protection provided by vaccination (analyzed as a time-dependent covariate) was evaluated using Cox proportional hazards regression. The analysis was adjusted for the propensity to get tested, age, sex, pandemic phase when the last prior COVID-19 episode occurred, and the number of prior vaccine doses.
Results Among 47561 employees, COVID-19 occurred in 838 (1.8%) during the 16-week study period. In multivariable analysis, the 2023-2024 formula vaccinated state was associated with a significantly lower risk of COVID-19 while the JN.1 lineage was the dominant circulating strain (hazard ratio

, .77; 95% confidence interval [C.I.], .62-.94; P = .01), yielding an estimated vaccine effectiveness of 23% (95% C.I., 6%-38%). Compared to 0 or 1 prior vaccine doses, risk of COVID-19 was incrementally higher with 2 prior doses (HR, .1.46; 95% C.I., 1.12-1.90; P < .005), 3 prior doses (HR, 1.95; 95% C.I., 1.51-2.52; P < .001), and more than 3 prior doses (HR, 2.51; 95% C.I., 1.91-3.31; P < .001).
Conclusions The 2023-2024 formula COVID-19 vaccine given to working-aged adults afforded a low level of protection against the JN.1 lineage of SARS-CoV-2, but a higher number of prior vaccine doses was associated with a higher risk of COVID-19.
Summary Among 47561 working-aged Cleveland Clinic employees, the 2023-2024 formula COVID-19 vaccine was 23% effective against the JN.1 lineage of SARS-CoV-2, but a higher number of prior COVID-19 vaccine doses was associated with a higher risk of COVID-19.

INTRODUCTION​

Although the original messenger RNA (mRNA) Coronavirus Disease 2019 (COVID-19) vaccines were highly effective early in the pandemic [1,2], their effectiveness decreased as the causative agent of COVID-19, the Severe Acute Respiratory Syndrome Coronavirus 2 (SARS-CoV-2) virus, evolved over time and new variants emerged. Concurrently, the human population developed an increasing level of herd immunity, resulting in a decrease in the number of people who got infected and a substantial decline in the occurrence of severe illness among those who got infected.
Newer vaccines were developed in an attempt to overcome diminishing vaccine effectiveness. Bivalent COVID-19 mRNA vaccines, which encoded antigens represented in the original vaccine as well as antigens representing the BA.4/5 lineages of the Omicron variant, were approved by the United States Food and Drug Administration (FDA), in August 2022. In our cohort of healthcare personnel in northern Ohio, we found that the effectiveness of the bivalent vaccines against COVID-19 decreased from 29% when the Omicron BA.4/5 lineages were the predominant circulating strains, to 19% when the BQ lineages were dominant, to no longer effective by the time the XBB lineages became dominant [3].
Moderna TX Inc. and Pfizer-BioNTech Inc. updated their mRNA COVID-19 vaccines (the updated ones designated as the 2023-2024 formulation) to more closely target circulating variants. Both of these vaccines encoded the spike protein of SARS-CoV-2 Omicron variant lineage XBB.1.5 (Omicron XBB.1.5) [4]. These updated vaccines were approved for emergency use by the FDA on 11 September 2023 [5], and the next day the CDC recommended them for everyone 6 months and older [
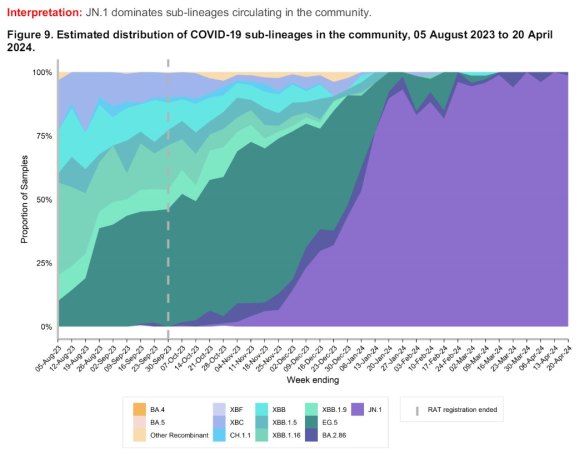
6]. However, by the time these vaccines became available to the public the XBB lineages were already no longer the dominant circulating strains in many parts of the USA, having been supplanted by the HV.1, EG.5, and other lineages [7]. Despite this, the 2023-2024 formulation of the COVID-19 vaccine had an effectiveness around 42% in the early weeks after the vaccine became available [8], providing reassurance that the vaccine was still effective even when the strain the vaccine targeted was no longer the dominant circulating strain. However, our earlier study only included a short duration while the JN.1 lineage was dominant, and was not able to show a statistically significant protective effect after the JN.1 lineage became the dominant circulating strain [8]. It is possible that the small number of events over the short duration of follow-up during this phase may have resulted in a protective effect being missed.
The purpose of this study was to evaluate, in a study with longer follow-up, whether the 2023-2024 formula COVID-19 vaccine protects against COVID-19 at a time when the JN.1 lineage of SARS-CoV2 is the predominant circulating strain.

METHODS​

Study design​

This was a prospective cohort study conducted at the Cleveland Clinic Health System (CCHS) in the United States.

Patient Consent Statement​

The study was approved by the Cleveland Clinic Institutional Review Board as exempt research (IRB no. 22-917). A waiver of informed consent and waiver of HIPAA authorization were approved to allow the research team access to the required data.

Setting​

Cleveland Clinic has always given very high priority to employee access to COVID-19 testing and COVID-19 vaccination and has carefully studied the effectiveness of the various iterations of the COVID-19 vaccines [911,3,12,8]. The JN.1 lineage of SARS-CoV-2 emerged near the end of the year 2023, and became the predominant circulating strain in Ohio around 31 December 2023. This date was considered this study’s start date.

Participants​

CCHS employees in employment at any Cleveland Clinic location in Ohio on the study start date were included in the study. Those for whom age and gender were not available were excluded.

Variables​

Covariates collected were age, sex, and job location, as described in our earlier studies [9,11,10,3,12,8]. Institutional data governance rules related to employee data limited our ability to supplement our dataset with additional clinical variables. Subjects were considered pre-pandemic hires if hired before 16 March 2020, the day COVID-19 testing became available in our institution, and pandemic hires if hired on or after that date.
Number of prior vaccine doses was the number of doses of older COVID-19 vaccines received. Prior COVID-19 was defined as a positive nucleic acid amplification test (NAAT) for SARS-CoV-2 any time before the study start date. The date of infection for a prior episode of COVID-19 was the date of the first positive test for that episode of illness. A positive test more than 90 days following the date of a previous infection was considered a new episode of infection. The propensity to get tested for COVID-19 was defined as the number of COVID-19 NAATs done divided by the number of years of employment at CCHS during the pandemic, before the study start date.
The distribution of circulating variants in Ohio at any time was obtained from monitoring data from the CDC [7]. The pandemic phase for prior episodes of COVID-19 (pre-Omicron, pre-XBB Omicron, and XBB Omicron or later) was defined by which variant/lineages accounted for more than 50% of infections in Ohio at the time of the infection [7].

Outcome​

The study outcome was time to COVID-19, the latter defined as a positive NAAT for SARS-CoV-2 any time after the study start date. Outcomes were followed until 22 April 2024, allowing for evaluation of outcomes up to 16 weeks from the study start date.

Statistical analysis​

Subjects infected with COVID-19 in the weeks preceding the study start date were not included until 90 days had passed since their recent prior infection. Individuals were considered vaccinated 7 days after receipt of a single dose of the 2023-2024 formula COVID-19 vaccine. Subjects whose employment was terminated during the study period before they had COVID-19 were censored on the date of termination.
A Simon-Makuch hazard plot [13] was created to compare the cumulative incidence of COVID-19 in the vaccinated and non-vaccinated states with respect to the 2023-2024 formula COVID-19 vaccine, by treating such vaccination as a time-dependent covariate. Curves for the non-vaccinated state were based on data while the vaccination status of subjects, with respect to the 2023-2024 formula COVID-19 vaccine, remained “non-vaccinated”. Curves for the vaccinated state were based on data from the date the vaccination status changed to “vaccinated”.
A Cox proportional hazards regression model was fit to examine the association of various variables with time to COVID-19. Vaccination with the 2023-2024 formula COVID-19 vaccine was included as a time-dependent covariate whose value changed from “non-vaccinated” to “vaccinated” 7 days after receipt of the vaccine [14]. The possibility of multicollinearity in the models was evaluated using variance inflation factors. The proportional hazards assumption was checked using log(-log(survival)) vs. time plots. Vaccine effectiveness (VE) was calculated from the hazard ratios (HRs) for 2023-2024 formula COVID-19 vaccination in the multivariable model using the formula VE = 1 - HR.
The analysis was performed by N. K. S. and A. S. N. using the survival package and R version 4.3.2 [1416].

RESULTS​

Of the 47 561 employees included in the study, 7598 had received the 2023-2024 formula COVID-19 vaccine before the study start date. By the end of the study 8613 (18%) had received the 2023-2024 formula COVID-19 vaccine, which was the Pfizer vaccine in 7589 (89%). One hundred and seven subjects (0.2%) were censored during the study because of termination of employment. Altogether, 838 employees (1.8%) acquired COVID-19 during the 16 weeks of the study.

Baseline characteristics​

Table 1 shows the characteristics of subjects included in the study. The mean age of study subjects was 42 years, and almost 75% were female. Among these, 22 389 (47%) had previously had a documented episode of COVID-19 and 17 630 (37%) had previously had an Omicron variant infection. 41 387 subjects (87%) had previously received at least one dose of a COVID-19 vaccine, 39 552 (83%) had received at least two doses, and 43 002 (90%) had been previously exposed to SARS-CoV-2 by infection or vaccination.
Table 1.Baseline characteristics of the 47561 employees of Cleveland Clinic in Ohio included in the study

Effectiveness of the 2023-2024 formula COVID-19 mRNA vaccine​

There was no significant difference in the cumulative incidence of COVID-19 in the 2023-2024 formula vaccinated state compared to the non-vaccinated state in an unadjusted analysis (Figure 1).
Simon-Makuch plot comparing the cumulative incidence of COVID-19 for the vaccinated and non-vaccinated states with respect to the 2023-2024 formulation COVID-19 vaccine. Day zero was 31 December 2023, the day the JN.1 lineage of SARS-CoV-2 was projected to have become the dominant circulating strain in Ohio. Individuals with recent past infections do not contribute to the denominator until it has been at least 90 days since their prior infection. Point estimates and 95% confidence intervals are jittered along the x-axis to improve visibility. Variant proportions are based on data from the CDC, considered to be in the middle of the week reported, grouped into pre-XBB, XBB, HV.1, EG.5, JN.1, and other lineages, and presented as an area plot with values extrapolated for day zero and the study end date using linear regression models with data for the weeks immediately before and after the target date.
" data-icon-position="" data-hide-link-title="0" style="-webkit-font-smoothing: antialiased; margin: 0px; padding: 8px; border: none; outline: 0px; vertical-align: baseline; font-style: inherit; font-variant: inherit; font-weight: 400; font-stretch: inherit; font-size: 0.857rem; line-height: inherit; font-family: inherit; font-optical-sizing: inherit; font-kerning: inherit; font-feature-settings: inherit; font-variation-settings: inherit; text-decoration: none; color: gray; display: block; box-shadow: rgba(0, 0, 0, 0.15) 0px 2px 10px 0px; background: rgb(255, 255, 255);">Figure 1.
Figure 1.
Simon-Makuch plot comparing the cumulative incidence of COVID-19 for the vaccinated and non-vaccinated states with respect to the 2023-2024 formulation COVID-19 vaccine. Day zero was 31 December 2023, the day the JN.1 lineage of SARS-CoV-2 was projected to have become the dominant circulating strain in Ohio. Individuals with recent past infections do not contribute to the denominator until it has been at least 90 days since their prior infection. Point estimates and 95% confidence intervals are jittered along the x-axis to improve visibility. Variant proportions are based on data from the CDC, considered to be in the middle of the week reported, grouped into pre-XBB, XBB, HV.1, EG.5, JN.1, and other lineages, and presented as an area plot with values extrapolated for day zero and the study end date using linear regression models with data for the weeks immediately before and after the target date.

In a multivariable Cox proportional hazards regression model, adjusted for propensity to get tested for COVID-19, age, sex, hire cohort, number of prior COVID-19 vaccine doses, and epidemic phase when the last prior COVID-19 episode occurred, vaccination with the 2023-2024 formula COVID-19 vaccine provided some protection against COVID-19 in the first 16 weeks after the JN.1 lineage of SARS-CoV2 became the dominant strain in Ohio (hazard ratio

, .77; 95% confidence interval [C.I.], .62-.94; P = 0.01). Point estimates and 95% confidence intervals for hazard ratios for the variables included in the unadjusted and adjusted Cox proportional hazards regression models are shown in Table 2. The calculated overall vaccine effectiveness from the model was 23% (95% C.I., 6%-38%).
Table 2.Unadjusted and Adjusted Associations with Time to COVID-19

The multivariable analysis also found that compared to receipt of 0 or 1 prior vaccine doses, risk of COVID-19 was increasingly higher with receipt of 2 prior doses (HR, .1.46; 95% C.I., 1.12-1.90; P < .005), 3 prior doses (HR, 1.95; 95% C.I., 1.51-2.52; P < .001), and more than 3 prior doses (HR, 2.51; 95% C.I., 1.91-3.31; P < .001). If number of prior vaccine doses was not adjusted for in the multivariable model, the 2023-2024 formulation of the vaccine was not protective against COVID-19 (HR 1.01, 95% C.I. .84 – 1.21, P = 0.95).

DISCUSSION​

This study found that the 2023-2024 formula COVID-19 mRNA vaccine was about 23% effective overall in protecting against infection with the JN.1 lineage of SARS-CoV-2. Although the vaccine was designed to target the XBB lineages of the Omicron variant, the vaccine was notably still effective even though practically all the infections occurring in the community during the study period were caused by the JN.1 lineage of the virus.
The strengths of our study include its reasonably large sample size and a robust methodology that has been refined by reviews over multiple publications [3,812]. Vaccine effectiveness is calculated from risk differences and should provide more accurate estimates than by extrapolations from odds ratios obtained from case-control studies as is commonly done [17]. Treating vaccination with the 2023-2024 formulation of the COVID-19 vaccine as a time-dependent covariate allows for determining vaccine effectiveness in real time, thereby providing results in a time frame when they are still meaningful.
The study has several limitations, which have all been discussed extensively in prior publications [3,1012]. Individuals with unrecognized prior infection would have been misclassified as previously uninfected. There could be concern that such misclassification could result in underestimating the protective effect of the vaccine, because the protection against disease afforded by natural immunity from prior infection would limit the detection of a vaccine effect. However, such misclassification would have occurred in both vaccinated and non-vaccinated states, and there is little reason to suppose that prior infections would have been missing in the vaccinated and non-vaccinated states at rates disproportionate enough to significantly affect the results of the study. Adjusting for hire cohort (pre-pandemic versus pandemic) in the multivariable analysis would have mitigated against bias that might arise from possible incomplete information on prior infection and prior vaccination among the pandemic hires compared to the pre-pandemic hires. The potential for risk of bias from difference in testing for COVID-19 among individuals inclined and not inclined to get vaccinated was mitigated by adjusting for the propensity of an individual to get tested for COVID-19. The widespread availability of home testing kits might have reduced detection of incident infections, but there is little reason to suppose a significant difference in home testing between the vaccinated and unvaccinated states. This potential effect should also be somewhat mitigated in our healthcare cohort because one needs a NAAT to get paid time off, providing a strong incentive to get a NAAT if one tests positive at home. We were unable to distinguish between symptomatic and asymptomatic infections. The number of severe illnesses was too small to examine as an outcome. Like our previous studies, this study was done in a healthcare population, and included no children and few elderly subjects, and most subjects would not have been expected to be immunocompromised.
Consistent with similar findings in many prior studies [3,8,10,12,1820], a higher number of prior vaccine doses was associated with a higher risk of COVID-19. The exact reason for this finding is not clear. It is possible that this may be related to the fact that vaccine-induced immunity is weaker and less durable than natural immunity. So, although somewhat protective in the short term, vaccination may increase risk of future infection because the act of vaccination prevents the occurrence of a more immunogenic event. Thus, the short-term protection provided by a COVID-19 vaccine comes with a risk of increased susceptibility to COVID-19 in the future. This understanding suggests that a more nuanced approach to COVID-19 is necessary. Although some individuals are at high risk of complications from COVID-19, and may benefit from receiving a vaccine frequently, the wisdom of vaccinating everyone with a vaccine of low effectiveness every few months to prevent what is generally a mild or an asymptomatic infection in most healthy persons, needs to be questioned.
In conclusion, this study found an overall low protective effect of the 2023-2024 formula COVID-19 vaccine against infection with the JN.1 lineage of SARS-CoV-2, while also finding that a higher number of prior vaccine doses was associated with a higher risk of COVID-19.

Notes​

Author contributions​

N. K. S.: Conceptualization, methodology, validation, investigation, data curation, software, formal analysis, visualization, writing-original draft preparation, writing-reviewing and editing, supervision, project administration. P. C. B.: Resources, investigation, validation, writing-reviewing and editing. A. S. N.: Methodology, formal analysis, visualization, validation, writing-reviewing and editing. S. M. G.: Project administration, resources, writing-reviewing and editing.

Potential conflicts of interest​

The authors: No reported conflicts of interest. All authors have submitted the ICMJE Form for Disclosure of Potential Conflicts of Interest. Conflicts that the editors consider relevant to the content of the manuscript have been disclosed.

Funding​

None.
 
Last edited:
don't care

didn't take the jab, never will
 

Opinion

The true tragedy of the Covid-19 vaccines​

Matt Ridley
Wed, May 1, 2024 at 2:16 PM EDT·4 min read

People queue outside a Covid-19 vaccination centre at St Thomas's Hospital in Westminster on December 13, 2021 in London

People queue outside a Covid-19 vaccination centre at St Thomas's Hospital in Westminster on December 13, 2021 in London
Vaccination is one of mankind’s most miraculous innovations. The eradication of smallpox, and the retreat of measles and other cruel afflictions, mean that vaccines rival sanitation for first prize in the saving of lives. New jabs against malaria and melanoma promise great benefits. All the more reason to worry that Covid vaccines may have tarnished the technology’s reputation.
Vaccines never have been without some side-effects and risks. They are harm-reduction interventions, not harm-elimination ones. Mistakes have been made in the past. Some polio jabs in the 1960s were contaminated with the monkey virus SV40. Vaccination campaigns in Africa that re-used needles may have helped spread HIV.
The Covid jabs developed in 2020 undoubtedly reduced the severity of the virus for vulnerable people and contributed to the defeat of the pandemic – though the evolutionary replacement of harmful variants by the milder omicron types may have been a bigger factor. But the vaccines were not as effective or as safe as we were led to believe at first.

Indeed, some public health officials exaggerated the benefits and underplayed some of the risks. Thrombosis caused by the AstraZeneca vaccine and myocarditis caused by the messenger-RNA vaccines of BioNTech and Pfizer have emerged as rare but serious side effects. The pandemic’s legacy now seems to include greater public mistrust of vaccines in general. Measles is on the rise. More people are refusing the MMR jab. A recent Unicef survey found that vaccine confidence had fallen in 52 out of 55 countries.
Who is responsible? Public health officials tend to blame antivaxx campaigners with lurid conspiracy theories about Bill Gates, and they are partly right. But perhaps they should also look in the mirror. Misinformation came from both sides, and by overpromising what the vaccines could do, and demanding vaccine mandates, many scientists and government officials contributed to scepticism.
For example, the US government tried to reassure people about messenger-RNA vaccines by implicitly criticising live vaccines like those used for measles: “The mRNA vaccines do not contain any live virus. Instead, they work by teaching our cells to make a harmless piece of a ‘spike protein’.” So, live vaccines are not “harmless”?
America’s leading infectious-disease expert, Anthony Fauci, said in May 2021 that vaccination “makes it extremely unlikely – not impossible, but very, very low likelihood – that they’re going to transmit it … In other words, you become a dead end to the virus.” That turned out to be wrong, as he later admitted, with the jab doing little to prevent reinfection and transmission.
Preventing transmission was the excuse used for vaccinating children, yet when that excuse evaporated, the policy continued. For young age groups, wrote a clutch of doctors in the BMJ in December 2021, “the harms of taking a vaccine are almost certain to outweigh the benefits”.
Authoritarianism made the problem worse. France criminalised criticism of vaccine mandates; Canada froze the bank accounts of truckers for protesting against them. Part of the reason governments were so reckless in forcing vaccines was probably that they wanted an exit from lockdowns, which were imposed for longer and more often than promised.
Some of us urged ministers not to claim too much for vaccines or pretend there would be no side effects as that would backfire. But the Government pressed ahead with mandates to prevent care-home workers going to work unless vaccinated. A study by doctors concluded: “Our data suggest that debate around mandates can arouse strong concerns and could entrench scepticism. Policymakers should proceed with caution.”
This was compounded by a baffling refusal to acknowledge that natural immunity from Covid itself had a role in protecting people. In 2020 a paper in The Lancet stated that “there is no evidence for lasting protective immunity to SARS-CoV-2 following natural infection”. Yet we now know that it lasts longer and is more effective than the protection provided by a jab.
The backlash against vaccines will go too far. Italy’s former health minister Roberto Speranza, who imposed vaccine mandates, can no longer walk in a street without angry Italians calling him a murderer. But public health officials worldwide must concede that overblown claims and underestimated risks of the vaccines developed during Covid have hurt the reputation of a valuable medical technology.
 

New SARS-CoV-2 KP.2 variant defies vaccines with higher spread, study warns​


Vijay Kumar Malesu


By Vijay Kumar Malesu Apr 29 2024 Reviewed by Susha Cheriyedath, M.Sc.
In a recent preprint* study posted to the bioRxiv server, a team of researchers analyzed the virological characteristics and epidemiological impact of the Severe Acute Respiratory Syndrome Coronavirus 2 (SARS-CoV-2) FLiRT variant KP.2, which has demonstrated increased transmissibility and immune resistance.
Study: Virological characteristics of the SARS-CoV-2 KP.2 variant. Image Credit: Orpheus FX / ShutterstockStudy: Virological characteristics of the SARS-CoV-2 KP.2 variant. Image Credit: Orpheus FX / Shutterstock
pdf-dl-cta.png
pdf-dl-cta.png
*Important notice: bioRxiv publishes preliminary scientific reports that are not peer-reviewed and, therefore, should not be regarded as conclusive, guide clinical practice/health-related behavior, or treated as established information.

Background​

The rapid emergence and diversification of the JN.1 variant and its descendant, KP.2, which shows significant alterations in spike (S) protein structure and increased resistance to existing vaccines, underscore the necessity for further research to understand the implications for public health and vaccine development.

About the study​

The present study was initiated by analyzing the genomic sequences of the KP.2 variant from surveillance data across the United States of America (USA), United Kingdom, and Canada, where over 30 sequences were reported. The relative effective reproduction number (Re) was calculated using a Bayesian multinomial logistic regression model, adjusting for various covariates that could influence transmission dynamics.
Subsequently, virological assays were conducted to evaluate the infectivity and immune evasion capabilities of KP.2. Lentivirus-based pseudovirus assays were performed using Human Osteosarcoma cells (HOS)- Angiotensin-Converting Enzyme 2 (ACE2)/Transmembrane Protease, Serine 2 (TMPRSS2) cells infected with pseudoviruses bearing the S proteins of KP.2, JN.1, and other relevant variants. The quantity of input virus was standardized against the Human Immunodeficiency Virus Type 1 (HIV-1) Protein 24 (p24) capsid protein. Statistical analysis was carried out using two-sided Student's t-tests to determine significant differences in infectivity between the variants.
For the neutralization assays, serum samples were collected from individuals in various immunization and infection states. These included vaccinated individuals both with and without prior infections and those who had recovered from specific variant infections. Each serum sample was tested in quadruplicate against pseudoviruses harboring different S protein mutations. The 50% neutralization titers (NT50) were calculated and compared across all serum samples to assess the degree of neutralization resistance posed by KP.2. Statistical significance of the differences in NT50 values was evaluated using two-sided Wilcoxon signed-rank tests.

Study results​

The study revealed that the KP.2 variant, a descendant of the JN.1 lineage, demonstrates significantly enhanced epidemiological fitness compared to its predecessors, including the dominant XBB lineage. This finding is confirmed by the Re estimated for KP.2 in the USA, United Kingdom, and Canada, where it was observed to be 1.22, 1.32, and 1.26 times higher than JN.1, respectively. The spread of KP.2 has been rapid, with its variant frequency reaching 20% in the United Kingdom as of early April 2024, suggesting a potential to become the predominant lineage globally.

Further virological investigation into KP.2 using a lentivirus-based pseudovirus assay highlighted a paradox wherein, despite its higher transmissibility, the infectivity of KP.2 was found to be significantly lower (10.5-fold) than that of JN.1. This reduced infectivity might suggest different mechanisms or pathways for KP.2's enhanced spread and establishment in the host populations.
In addition to infectivity, resistance to neutralization was assessed through assays using sera from individuals vaccinated with the monovalent XBB.1.5 vaccine and those who had breakthrough infections with various SARS-CoV-2 variants. KP.2 exhibited significant resistance to neutralization, with a 3.1-fold reduction in susceptibility to neutralization by sera from vaccines without infection and a 1.8-fold reduction from those with prior infections. This increased resistance could partially explain the higher Re of KP.2, indicating an enhanced ability to evade immune responses compared to JN.1 and other previous variants.
 

Users who are viewing this thread

Back
Top