should look at PPP for more accurate picture, not USD nominal numbers
GDP PPP (IMF):
- Indonesia: $5.02 trillion
- Turkey: $3.77 trillion
- Saudi: $2.69 trillion
- Egypt: $2.38 trillion
- Iran: $1.88 trillion
- Pakistan: $1.67 trillion
- Malaysia: $1.48 trillion
- UAE: $0.93 trillion
- Qatar: $0.38 trillion
Egypt seems to be underperforming considering it has 120 million population and no sanctions
Indonesia has 280 million population so makes sense it is the largest economy
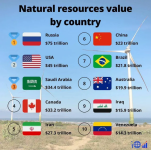
Iran would be Turkey++ without 50 years of US economic embargo and incompetent government, as Iran has the 5th most valuable mineral reserves of any country in the world
View attachment 154043
As Mark Twain said: "There are lies, damned lies and statistics".
First of all, IMF doesn't produce its own data on GDP, but relies on statistical data collected by Statistical Agencies of different countries. IMF then process this data and publishes its own IMF statistics based on information provided by Statistical Agencies of different countries.
Second, Statistical Agencies of different countries either include partially or don't include at all Shadow economy in their GDP calculation.
Shadow economy = Informal Economy + Illegal Economy.
Fore example, in 2019 Russian Statistical Agency estimated shadow economy of Russia at 12% of GDP and included this data in its GDP and provided this data to the IMF.
But independent IMF research on shadow economy of different countries put Russian shadow economy size at 35% of GDP. So in 2019 Russian economy was significantly underestimated.
The most precise data on GDP is that of EU countries. These countries has small shadow economies but even this is estimated by Statistical Agencies of EU countries and included in their GDPs.
EU countries even include illegal prostitution and drug trade in their GDP calculation and this adds another 1% to their GDP.
But even EU countries still have some 4% of GDP as shadow economy that is missed in calculations and is not included in their GDPs.
In Iran shadow economy is large because of sanctions, smuggling, cash transactions and is estimated to be 35-40% of GDP.
So real GDP PPP of Iran is not 1,88trln$ but 2,53trln$ assuming 35% shadow economy.
Then there are countries like India and Egypt that have overestimated GDPs due to defected data collection methods and defected GDP calculations.
Lets compare Egypt with Iran by other indicators of economy size like electricity consumption and car sales.
According to IMF:
Egypt's GDP PPP is 2,38trln$ and GDP PPP per capita is 20.000$
Iran's GDP PPP is 1,88trnl$ and GDP PPP per capita is 20.000$
So you might assume that Egypt has larger economy than Iran while Egyptians enjoy the same standard of living as Iranians.
But lets compare other indicators:
Egypt:
population: 116,5mln
urbanization rate: 43% (50mln urban dwellers)
electricity consumption: 218 bln Kwh
electricity consumption per capita: 1871 Kwh
car sales: 180.000 cars per year (1 car per 647 people)
Iran:
population: 92,5mln
urbanization rate: 77% (71mln urban dwellers)
electricity consumption: 380 bln Kwh
electricity consumption per capita: 4108 Kwh
car sales: 1000.000 cars per year (1 car per 92,5 people)
How come Egypt which has less urban population than Iran, consumes 1,75 times less electricity than Iran (despite having larger population), consumes 2,2 times less electricity per capita and has only 1 sold car per 647 people compared to 1 sold car per 92 people in Iran, has "LARGER" economy than Iran and "SAME" standard of living?
The truth is that Egyptian economy is significantly overestimated and in reality is substantially smaller than Iran's, while Iran's economy is probably underestimated by some 35-40%.





















:max_bytes(150000):strip_icc()/GettyImages-1323151704-53b2c793e93f4e4988a4002c955f48c0.jpg)